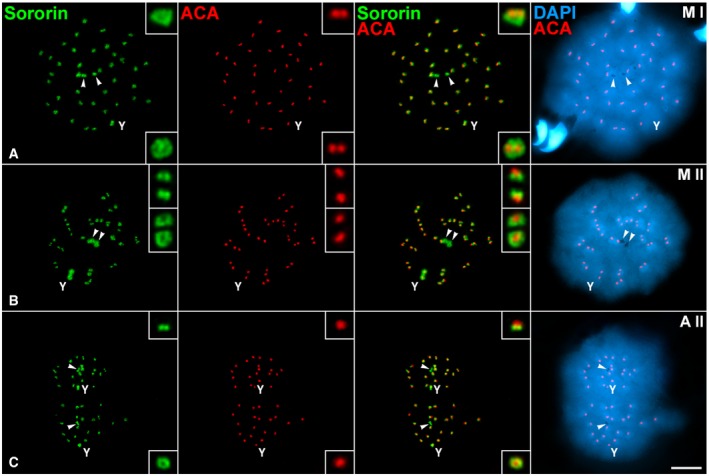
Figure 5. Relative distribution of Sororin and kinetochores during the meiotic divisions.

-
A–CDouble‐immunolabeling of Sororin (green) and kinetochores (ACA serum, red), and counterstaining of the chromatin with DAPI (blue) on spread spermatocytes at (A) metaphase I (M I), (B) metaphase II (M II), and (C) anaphase II (A II).
