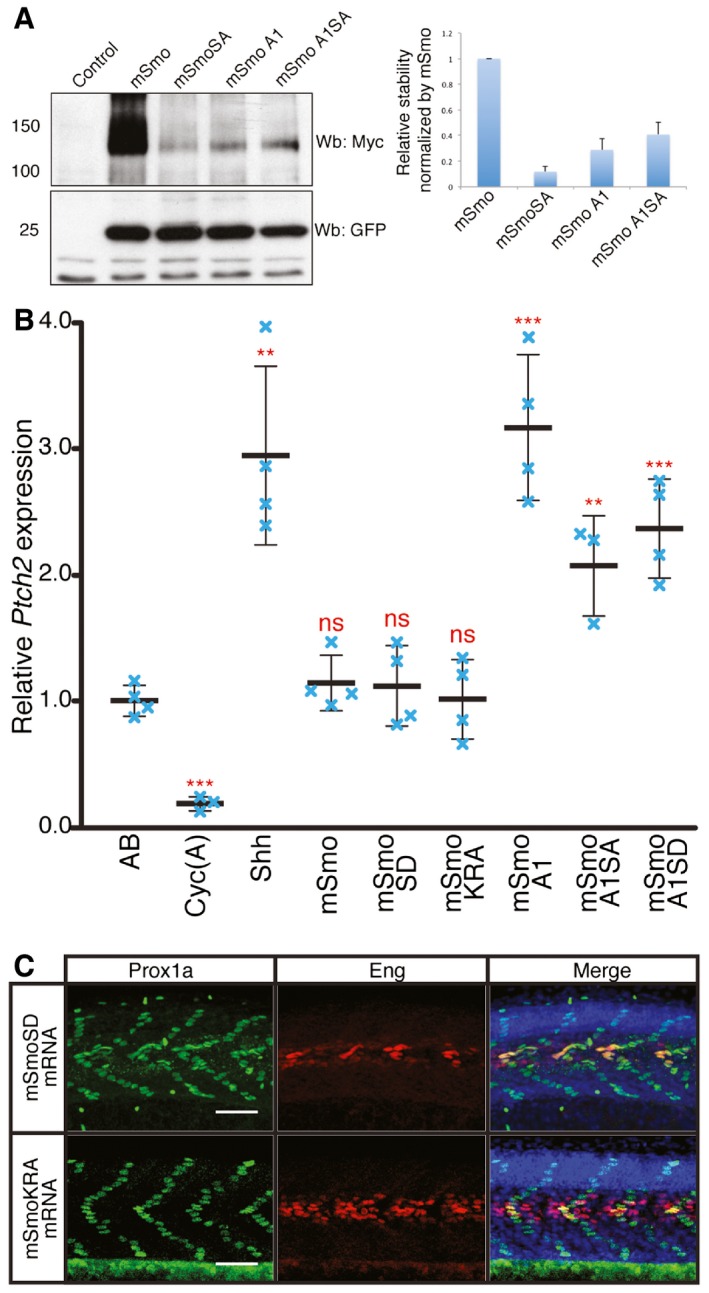
Figure EV2. Phosphorylation and dimerisation of Smo does not impair or enhance Hh activity.

- Western blot analysis of wild‐type and mutant forms of Smo expressed from bicistronic myc‐tagged mSmo and GFP constructs injected into wild‐type zebrafish embryos. The histogram shows the quantification of Myc‐tagged mSmo vs. GFP (n = 3). The error bars indicate SD.
- Normalised expression of ptch2 in 18hpf wild‐type (AB), Cyc(A)‐treated embryos and embryos injected with mRNA encoding Shh or various Smo mutants. Individual data points (blue crosses) are shown; mean is indicated by thick solid line, and SD by thin bars. Unpaired Student's t‐test was used to determine the statistical significance between control (AB) and experimental embryos. ***P < 0.001; **P < 0.01; and n.s. (not significant).
- Prox1a and Eng expression in smo hi1640 mutant embryos injected with mRNA encoding mSmoSD (n = 7) and mSmoKRA (n = 7). These mutant embryos show full recovery of SSFs and MPs. Embryos shown are at 30hpf. Scale bar, 50 μm.
