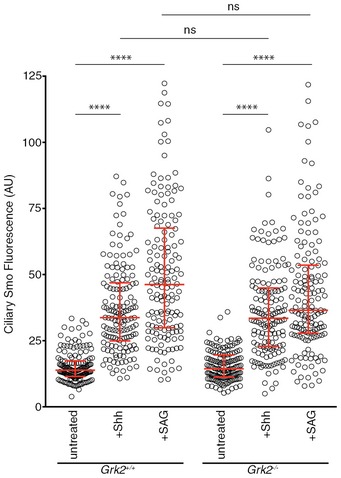
Figure EV3. Smo translocates to the primary cilium independently of Grk2.

Accumulation of endogenous Smo in the PC of wild‐type and Grk2 −/− Flp‐In‐3T3 cells after 4 h of Shh‐N and SAG treatment. The medians with interquartile range of the fluorescence intensities of endogenous Smo are shown, quantified from multiple cilia (n = 150). Data were analysed using Kruskal–Wallis non‐parametric ANOVA. ****P < 0.001 and n.s. (not significant).
