-
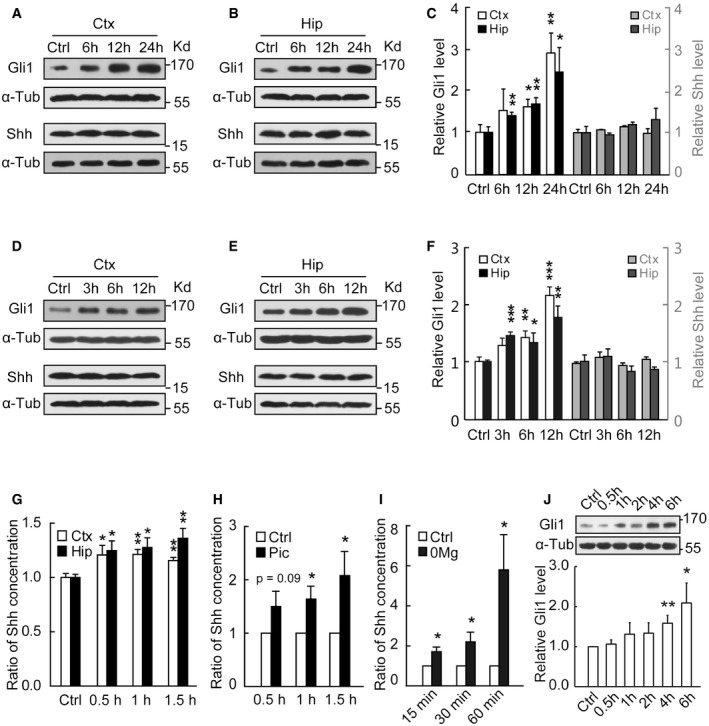
A–C
Representative Western blots of the cortical (Ctx) or hippocampal (Hip) extracts from mice at the indicated time after seizure activity in pilocarpine model. (C) Quantification of Gli1 or Shh expression levels shown in (A, B). n = 8–14 mice.
-
D–F
Representative Western blots of the cortical (Ctx) or hippocampal (Hip) extracts from mice at the indicated time after seizure activity in kindling model. Samples were obtained from mice evoked with a single kindling stimulation to induce seizure activity as evidenced in EEG. (F) Quantification of Gli1 or Shh expression levels shown in (D, E). n = 8–23 mice.
-
G
Shh levels assayed by ELISA from mouse cortex and hippocampus at the indicated time after the initiation of status epilepticus (SE) induced by pilocarpine (n = 7–10).
-
H, I
Shh levels assayed by ELISA in the medium of slices (H, n = 9) or hippocampal neurons (I, n = 6) incubated with picrotoxin (Pic) or Mg2+‐free (0Mg) for the indicated times.
-
J
Representative Western blots and quantification of Gli1 expression levels from hippocampal neurons incubated with 0Mg for the indicated times (n = 13–19).
Data information: α‐Tubulin (α‐Tub) was used as a loading control. Data are mean + SEM. *
P < 0.05; **
P < 0.01; ***
P < 0.001 vs. Control (Ctrl) with Student's
t‐test.

