-
A
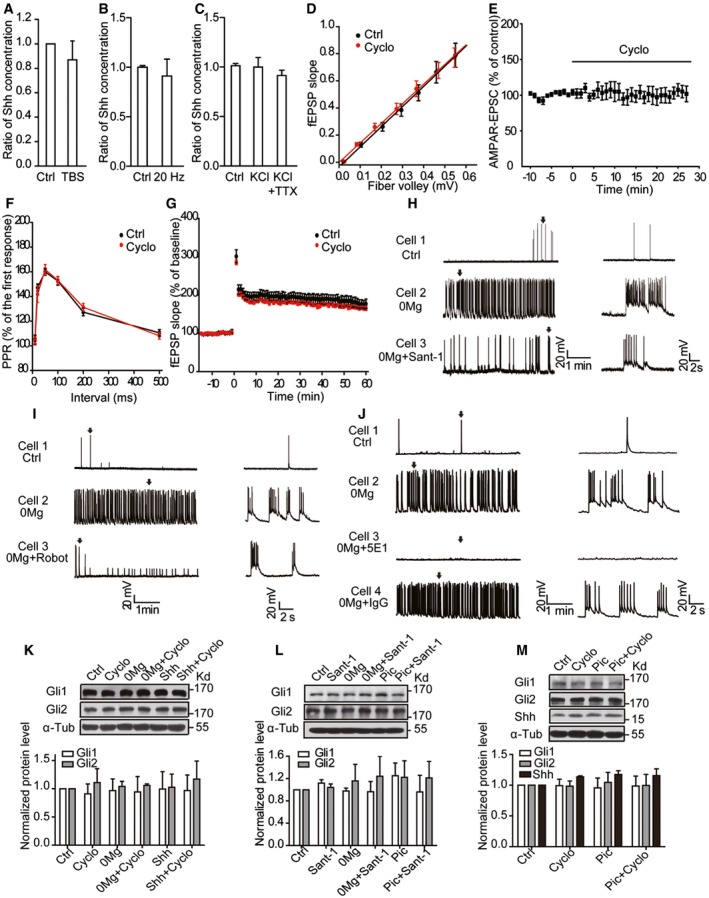
Shh levels determined by ELISA in the medium of hippocampal slices with or without (Ctrl) TBS stimuli. TBS: theta‐burst stimuli. n = 4–8.
-
B, C
Shh levels determined by ELISA in the medium of hippocampal neurons with or without 20‐Hz electrical stimulation for 30 min (B, n = 6–7) or incubated with the indicated treatments (C, n = 11). KCl, 50 mM; TTX, 1 μM.
-
D
Input–output curves recorded from CA1 stratum radiatum of hippocampal slices treated with Cyclo or vehicle (Ctrl). fEPSP: field excitatory postsynaptic potential. n = 8.
-
E
Normalized amplitude of AMPA receptor‐mediated current at −70 mV. Black line: perfusion of Cyclo. EPSC: excitatory postsynaptic current. n = 11.
-
F
Quantification of the paired‐pulse ratio (PPR) of fEPSP in CA1 of hippocampal slices treated with Cyclo or vehicle (Ctrl). n = 9.
-
G
TBS‐induced LTP in the presence of Cyclo or vehicle (Ctrl). The slope of fEPSP plotted as percent of baseline before TBS. n = 9.
-
H–J
Effects of Sant‐1 (H), robotnikinin (Robot, I), or 5E1 (J) on the spontaneous epileptiform activity from hippocampal neurons incubated with 0Mg. Left: representative traces of whole‐cell recordings with the indicated treatments. Right: the expanded view of a single burst (arrow) from the left parallel panels.
-
K, L
Representative Western blots and quantification of Gli1 and Gli2 expression levels from cultured hippocampal neurons under the indicated treatments for 30 min. n = 3.
-
M
Representative Western blots and quantification of Gli1, Gli2, and Shh expression levels from hippocampal slices under the indicated treatments. n = 3.
Data information: Cyclo: 5–10 μM used in all experiments. In (D, F, G), Cyclo was pre‐incubated for 30 min. α‐Tubulin (α‐Tub) was used as a loading control. Data are mean ± SEM. Student's
‐test was used.

