-
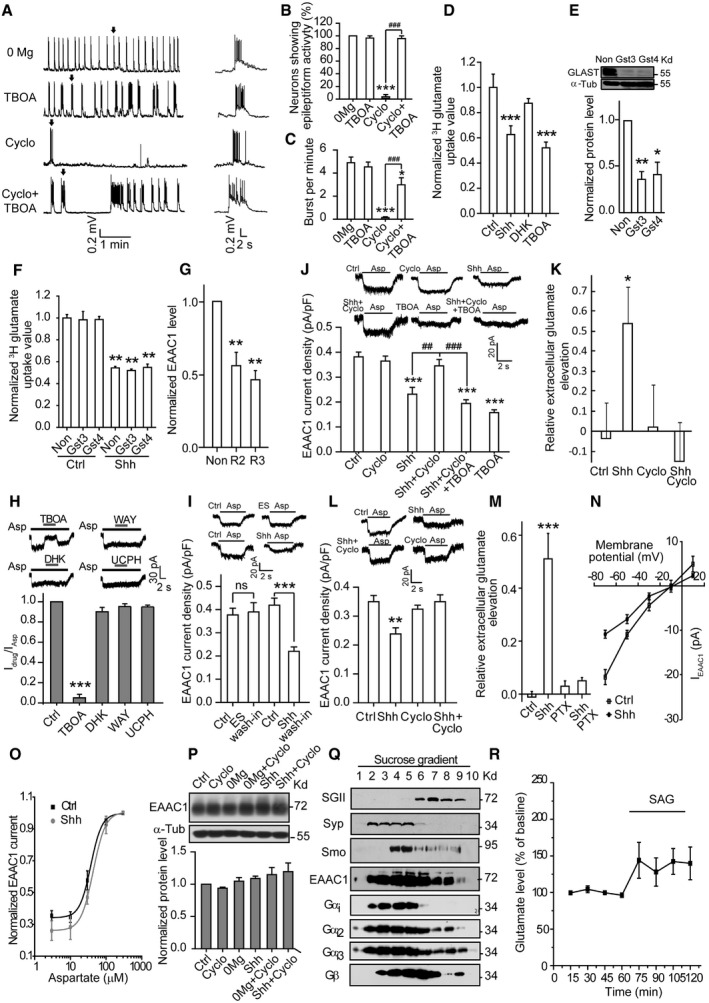
A–C
Whole‐cell recordings of spontaneous epileptiform activity from cultured hippocampal neurons. (A) Left: representative traces showing the neuronal activity under the indicated treatments. Right: the expanded view of a single burst (arrow) from the left panel. (B) Quantification of the percentage of neurons showing epileptiform activity, n = 4–5. (C) The burst frequency shown in (A), n = 15–18.
-
D
Quantification of 3H‐glutamate uptake by neurons in response to vehicle (Ctrl) or the indicated agents. n = 3–9.
-
E
Upper panel: representative Western blots of the extracts from hippocampal neurons transfected with two lentivirus‐based RNAi against GLAST (Gst3 or Gst4) or nonsense RNAi (Non). Lower panel: quantification of normalized GLAST protein levels, n = 3.
-
F
Statistics of 3H‐glutamate uptake by cultured hippocampal neurons transfected with the indicated RNAi in response to Ctrl or Shh. n = 3.
-
G
Quantification of EAAC1 levels in cultured hippocampal neurons transfected with two lentivirus‐based RNAi against EAAC1 (R2 or R3) or nonsense RNAi (Non). n = 3.
-
H
Quantification of the normalized current amplitude (13–22 cells in each group) of aspartate (Asp)‐evoked current in neurons treated with Ctrl, TBOA, DHK, WAY213623 (WAY, a selective inhibitor of GLT‐1), or UCPH‐101 (UCPH, a selective inhibitor of GLAST).
-
I
The effect of Shh on EAAC1 current density in the wash‐in method (n = 9). ES: extracellular solution. ns: not significant.
-
J
Quantification of EAAC1 current density from hippocampal neurons with the indicated treatments (n = 15–17).
-
K
Glutamate levels assayed by HPLC in the medium of neurons incubated with ARA‐C and treated with the indicated agents. n = 6–11.
-
L
Asp‐evoked currents from hippocampal neurons incubated with ARA‐C and treated with the indicated agents. n = 14–15.
-
M
Glutamate levels in the medium of neurons pretreated with Ctrl or Shh in the absence or presence of pertussis toxin (PTX). n = 8–9.
-
N
The current–voltage (I–V) relationship of Asp‐induced currents recorded from hippocampal neurons in response to vehicle (Ctrl) or Shh, from 10 to 24 cells in each group.
-
O
The dose–response curve of Asp‐evoked EAAC1 currents, obtained from hippocampal neurons at −70 mV. There was no significant difference between Ctrl and Shh in all concentrations from 12–13 cells. The EC50 of Ctrl or Shh was 37.33 ± 2.56 or 43.61 ± 0.63 μM, respectively. The dose–response curve was fitted by logistic equation: y = A
2 + (A
1 – A
2)/[1 + (x/x
0)p], where y is the response; A
1 and A
2 are the maximum and minimum response, respectively; x is the drug concentration; and p is the Hill coefficient.
-
P
Upper panel: representative Western blots of the extracts of hippocampal neurons under the indicated treatments using the indicated antibodies. Lower panel: quantification of the normalized expression level of EAAC1. n = 3.
-
Q
Representative Western blots of fractionated lysates of rat hippocampus with antibodies against secretogranin II (SGII), synaptophysin (Syp), Smo, EAAC1, Gαi‐pan (Gαi), Gαi2, Gαi3, or Gβ‐pan (Gβ). SGII: a marker of large vesicles; Syp: a marker of small vesicles.
-
R
Effect of SAG on extracellular glutamate in mouse hippocampus. n = 11.
Data information: The upper panels in (H, I, J, L) show representative traces of Asp‐evoked current. α‐Tubulin was used as a loading control. DHK: 300 μM; TBOA: 100 μM; WAY213623: 300 nM; UCPH‐101: 10 μM. Data are mean ± SEM from at least three independent experiments. *
< 0.001 vs. 0Mg, Ctrl, Non or Ctrl (Non);
< 0.001 vs. Cyclo in (B) and (C);
< 0.001 vs. Shh or Shh + Cyclo in (J) with Student's
‐test.

