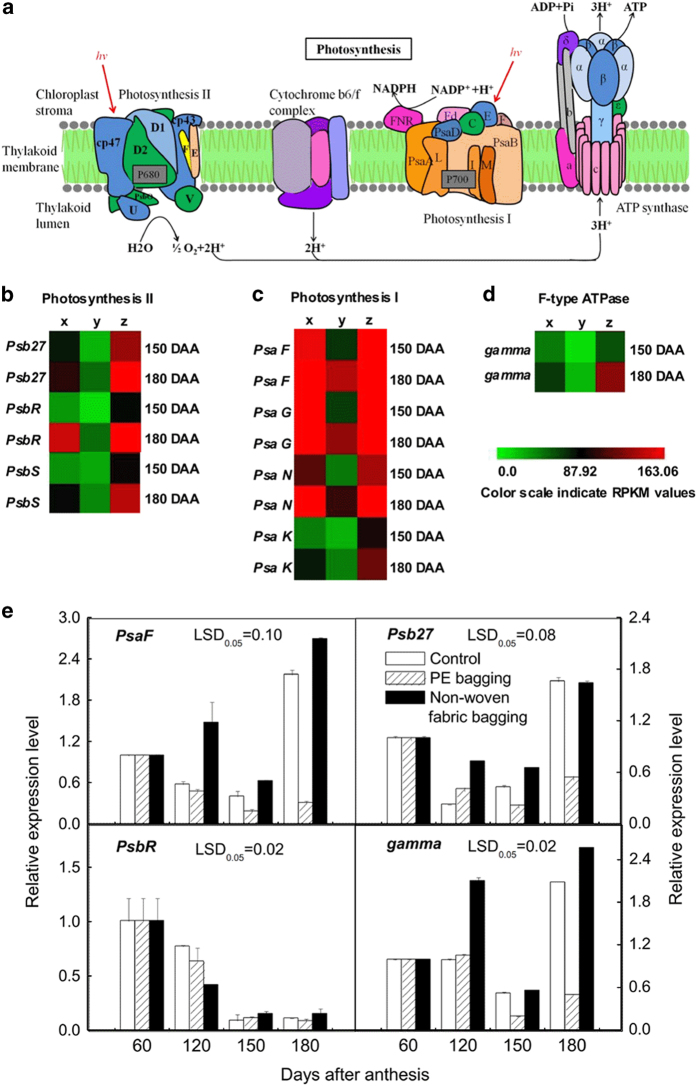
Figure 5.
The photosynthesis of ‘Chili’ pear with different bagging treatments. (a) The pathway of photosynthesis-antenna proteins (based on the KEGG pathway, http://www.kegg.jp/kegg-bin/show_pathway?map00195). (b) Photosystem II gene expression patterns are indicated by RPKM values. (c) Photosystem I gene expression patterns are indicated by RPKM values. (d) F-type ATPase gene expression patterns are indicated by RPKM values. (e) Gene expression level is inferred by q-PCR. Error bars on each column indicate SEs from three replicates. The expression pattern of each DEG is shown by 3 grids: the left one represents the RPKM value of the unbagged fruit (x), the middle one represents the RPKM value of the PE-bagged fruit (y) and the right one represents the RPKM value of the non-woven fabric-bagged fruit (z). The grids with different colors from green to red show the absolute expression magnitude with the RPKM values 0–163.06. DAA, days after anthesis.

