Figure 4.

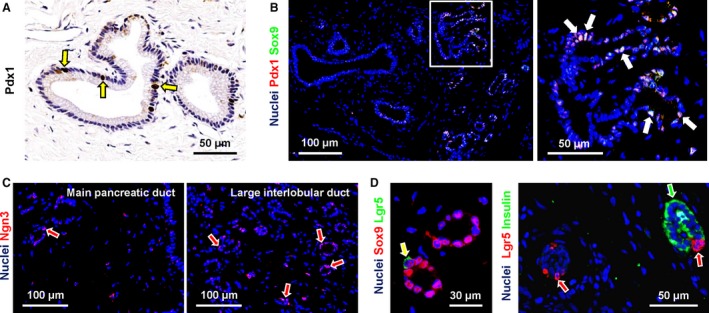
Expression of progenitor cell markers in pancreatic duct glands (PDGs). (A) Immunohistochemistry for Pdx1 in human pancreas. PDG cells were diffusely positive for Pdx1 (arrows). (B) Double immunofluorescence for Pdx1 (red) and Sox9 (green); the nuclei are displayed in blue. Pdx1 co‐localized with Sox9 in the same PDG cells (white nuclei, white arrows). (C) Immunofluorescence for Ngn3. Nuclei are displayed in blue. Ngn3+ cells were more numerous in PDGs associated with large interlobular ducts (arrows in right image) in comparison with the main pancreatic duct (left image). (D) Double immunofluorescence for Lgr5 and Sox9 (left) or insulin (right); the nuclei are displayed in blue. Left image: Lgr5+ cells co‐expressed Sox9 (arrow). Right image: Lgr5+ cells (red arrows) were negative for insulin (green arrow).
