
Figure 6.
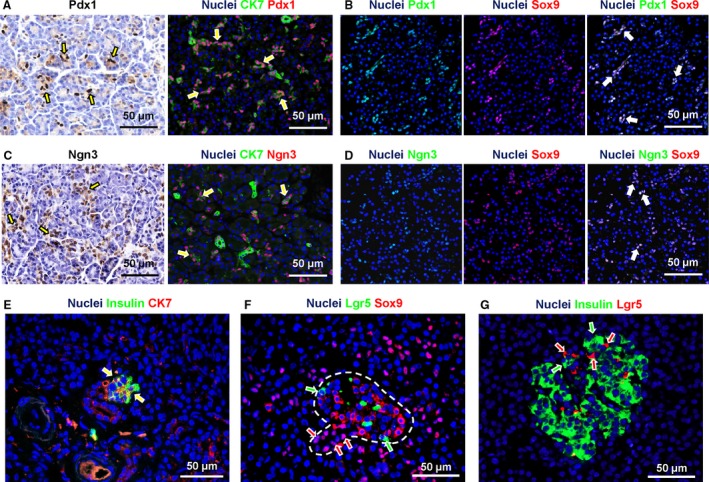
Expression of progenitor cell markers in intercalated ducts. (A) Immunohistochemistry for Pdx1 and double immunofluorescence for Pdx1 and cytokeratin(CK)7. Intercalated ducts were diffusely Pdx1+ (arrows). (B) Double immunofluorescence for Pdx1 and Sox9 showed that Pdx1 mostly co‐localized with Sox9 in intercalated duct cells (white nuclei in the merged image: arrows). (C) Immunohistochemistry for Ngn3 and double immunofluorescence for Ngn3 and CK7. Numerous intercalated duct cells were Ngn3+ (arrows). (D) Double immunofluorescence for Ngn3 and Sox9 showed that Ngn3 mostly co‐localized with Sox9 in intercalated duct cells (white nuclei in the merged image: arrows). (E) Double immunofluorescence for insulin and CK7. Some intercalated ducts appeared in continuity with clusters of insulin+ cells organized in small pancreatic islet‐like structures; in these cases, CK7+ duct cells were in direct continuity with islets. Moreover, CK7+/insulin+ cells were present at the interface between duct and islet (arrows). (F) Double immunofluorescence for Sox9 and Lgr5. Intercalated duct cells in continuity with endocrine islets had Sox9+ nuclei (red arrows); moreover, transitioning from duct to islet, cells lost nuclear Sox9 positivity. Lgr5+ cells were also present (two to three cells per islet) within pancreatic islets. Within the islets, Sox9 positivity did not overlap with Lgr5 expression (green arrows). (G) Double immunofluorescence for insulin and Lgr5; within the islets, Lgr5 positivity (red arrows) did not overlap with insulin expression (green arrows). In immunoflurescence images, nuclei are displayed in blue.