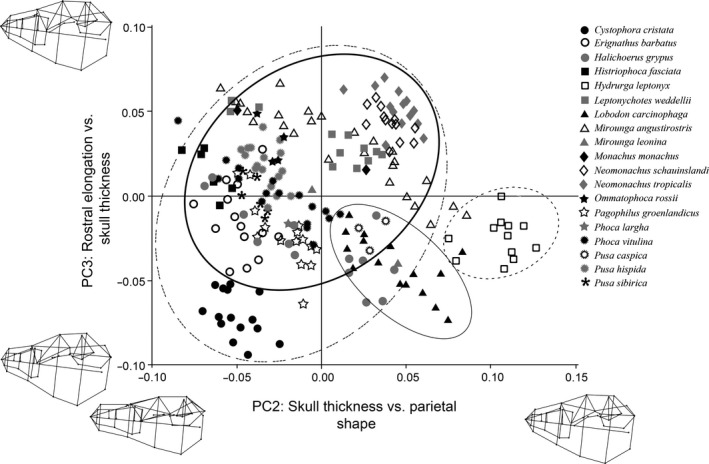
Figure 4.

Cranial PCA results comparing PC2 and PC3. Each shape represents a species, and each point represents a specimen. Ovals represent 90% confidence intervals for each feeding strategy: grip and tear feeders (dotted line); filter feeders (thin solid line); suction feeders (dashed line); pierce feeders (thick solid line). Wireframe diagrams of the shape changes in the positive and negative direction are shown along each axis.
