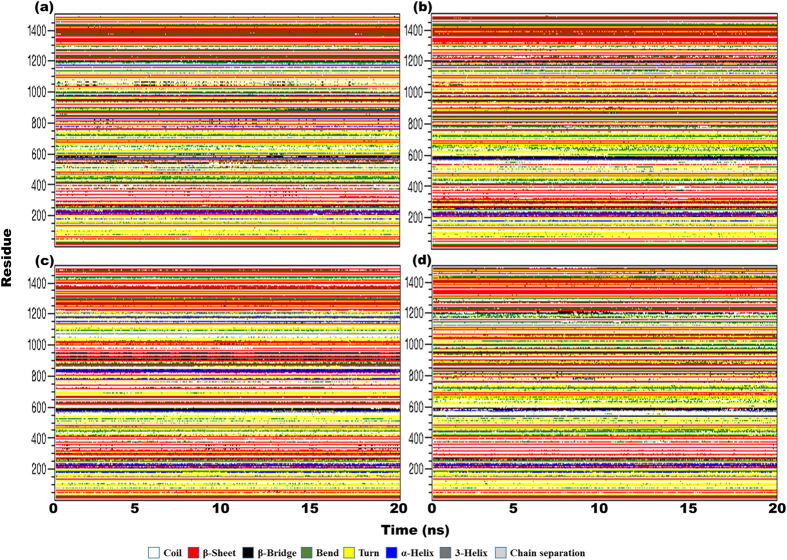
Figure 3. Secondary structure assessment over time.
Secondary structures were calculated per the definition in the database of secondary structure assignments (DSSP) for the entire complex for the last 20 ns of each trajectory; structural evolution is represented in (a) TLR4WT, (b) TLR4GI, (c) TLR4G299, and (d) TLR4I399. Time is indicated on the x-axis, while residue numbers are indicated on the y-axis. The key describing the structural assignments is also shown.

