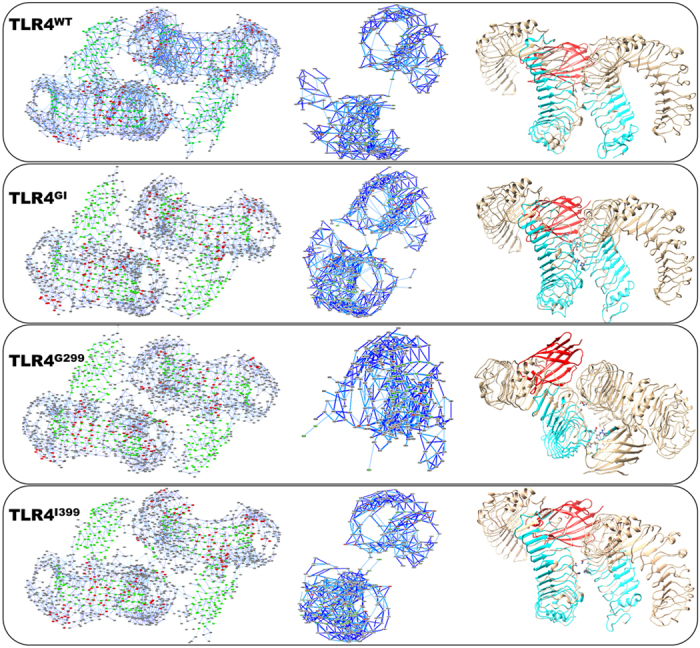
Figure 9. Residue interaction network.

The residue interaction network (RIN) was created and analyzed by StructureViz and RINalyzer, respectively, with a non-bonded contact cutoff of 5 Å. In the first panel, RIN representation of every complex is shown; where red indicates helices, green indicates β-sheets, and gray indicates the loop secondary structures. The dark blue line represents main chain interactions, whereas light blue lines represents side chain interactions. The middle panel refers to the pathway starting from position 299 of chain A from TLR4 and highlights the path of communication at dimer interface. Only nodes involved in signal transmission are shown. The last panel shows the structure of the protein onto which the signaling pathway has been mapped. Amino acids involved in signaling are represented by cyan, while the communicating amino acids are represented as a stick model with an atom-based coloring scheme. One MD2 is given in red, while the second, if not involved in signaling, is concealed for clarity.
