
Figure 6.
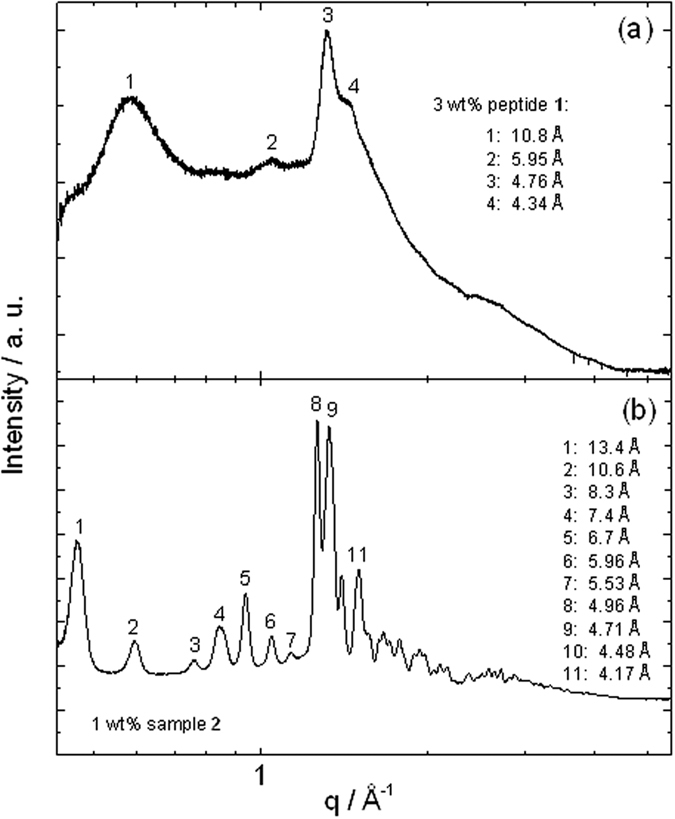
XRD profiles from dried stalks prepared from (a) 3 wt% sample 1 and (b) 1 wt% sample 2, with principal peaks labelled.
Official websites use .gov
A
.gov website belongs to an official
government organization in the United States.
Secure .gov websites use HTTPS
A lock (
) or https:// means you've safely
connected to the .gov website. Share sensitive
information only on official, secure websites.
XRD profiles from dried stalks prepared from (a) 3 wt% sample 1 and (b) 1 wt% sample 2, with principal peaks labelled.