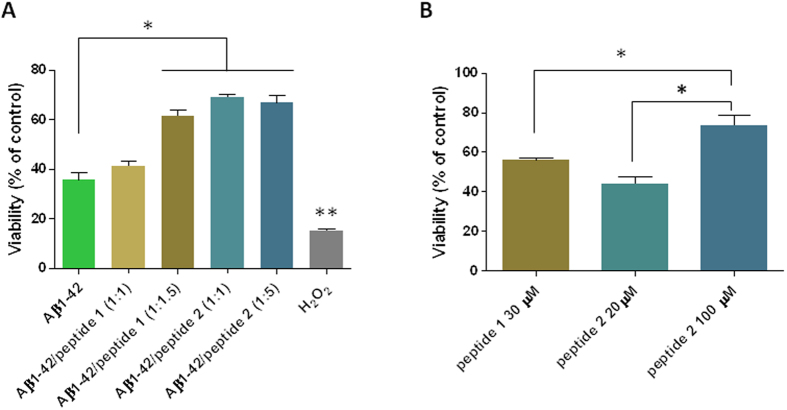
Figure 9. Peptides 1 and 2 reduced the toxic effect of Aβ(1–42) upon primary neurons. Panel A; neurotoxicity of Aβ(1–42) alone or co-incubated with peptide 1 or peptide 2 at the indicated molar ratios (Aβ: peptides).
Peptide 1 at 1:1.5 and peptide 2 at 1:1 and 1:5 induced a significant reduction of Aβ toxicity. Bars represent the mean values ± SEM (standard error of the mean) of three MTS assays. *p < 0.01. H2O2 toxicity was significantly higher as compared to all other conditions (**p < 0.001). Data were analyzed by one way ANOVA followed by Bonferroni’s post-hoc test. Panel B; cell toxicity induced by peptides 1 and 2 alone at the concentrations used in co-incubations that reduced Aβ(1–42) toxicity. The means ± SEM of three assays are depicted. *p < 0.05 (one-way ANOVA and Bonferroni’s post hoc test).

