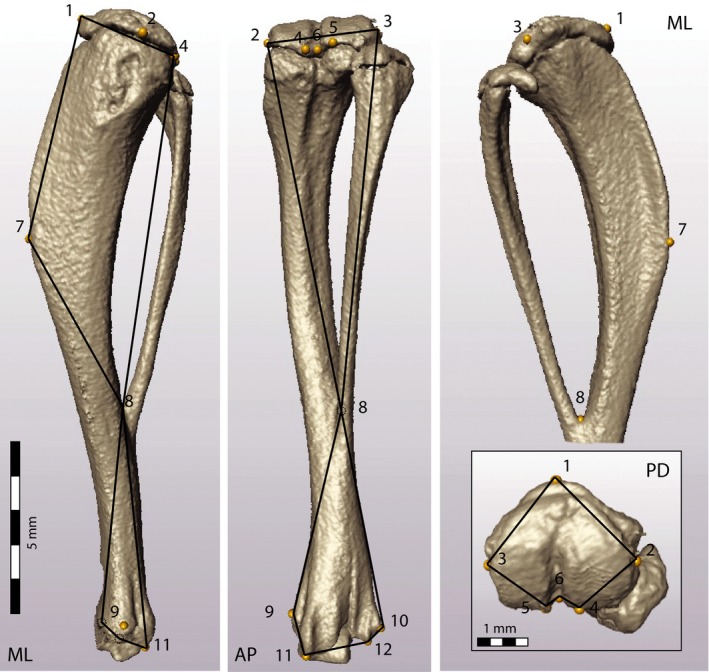
Figure 1.

Representative μCT scan of the right tibia, showing the location of the 16 landmarks for 3D geometric morphometric analyses (Table 1). The medio‐lateral (ML, left), antero‐posterior (AP, center) and proximo‐distal (PD, lower right inset) views also show the wireframes (black outlines) used to assess the shape deformations associated with the principal component scores in Figs 2 and 4.
