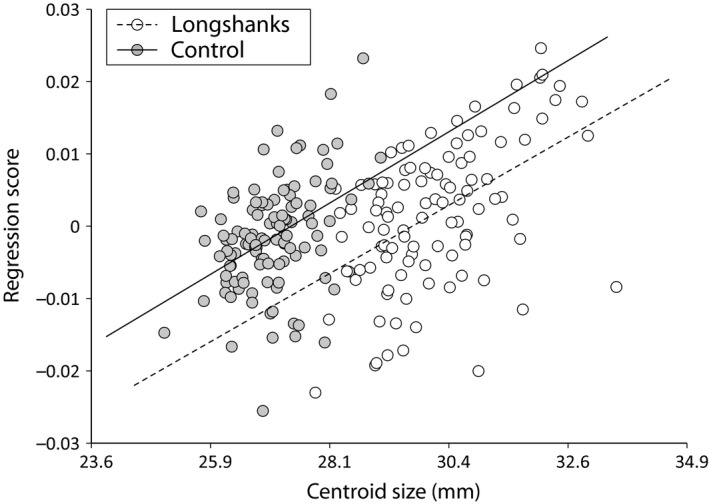
Figure 3.

Scatterplot of the multivariate regression of Procrustes coordinates on CS in Longshanks and Control, pooled within group. The non‐overlapping regression lines indicate a different relationship between CS and shape in the two groups, implying a change in the allometric effect of size in the Longshanks relative to the Control tibia.
