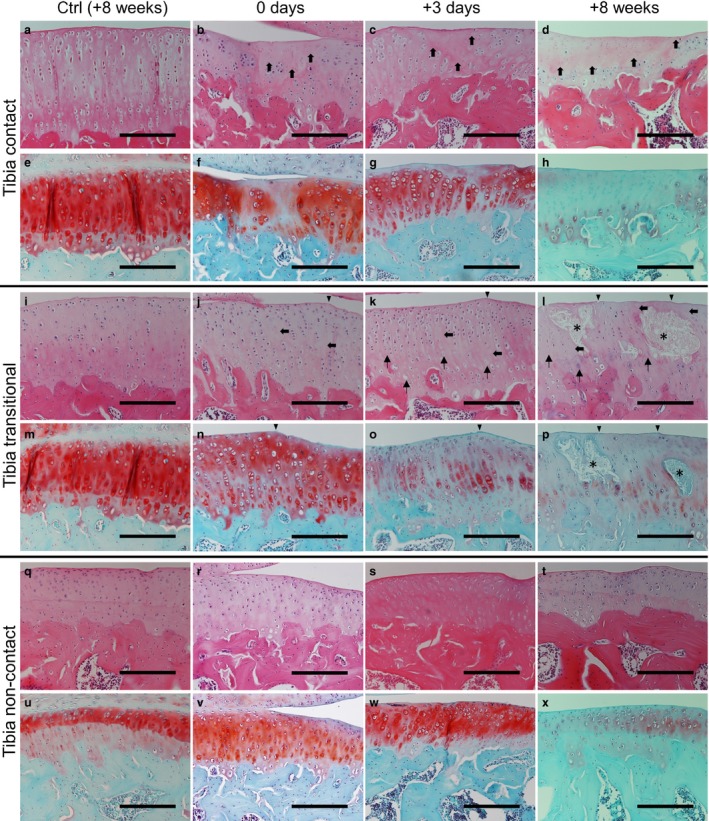
Figure 3.

Histological changes in the tibia at 8 weeks in the control group (HE: a, i and q; SO: e, m and u) and at 0 days (HE: b, j and r; SO: f, n and v), 3 days (HE: c, k and s; SO: g, o and w) and 8 weeks (HE: d, l and t; SO: h, p and x) in the experimental group. After immobilization, hypocellularity was observed in the surface‐to‐middle layers in the contact regions (b; bold arrows). Slight surface irregularities (arrowhead) and hypocellularity (bold arrows) were observed in the transitional region (j), whereas only hypertrophic chondrocytes were observed in the non‐contact region (r). SO staining intensity was reduced in all regions (f, n and v). After the remobilization period, hypocellularity (c, d, k and l; bold arrows) and reduced SO staining intensity (g, h, o and p) were observed over time in both the contact and transitional regions. The presence of chondrocytic lacunae with pyknotic or absent nuclei and cell degeneration over time were confirmed in the transitional regions of the experimental group (k and l; arrows). Cyst formation (asterisks) was observed frequently in the transitional region of the tibia at 8 weeks (l and p). Hypertrophic chondrocytes were observed in the non‐contact region throughout the experimental period (s and t). Low SO staining intensity was also observed in the non‐contact region (w and x). Scale bars: 200 μm.
