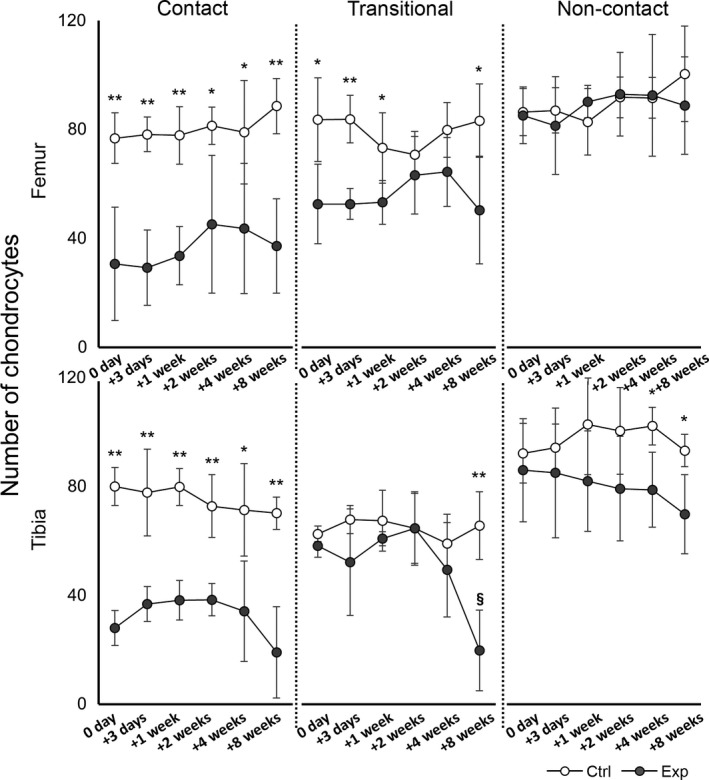
Figure 6.

Time course of changes in the number of chondrocytes in the femur (upper row) and tibia (lower row). The results of the control group (ctrl) are indicated by white circles; those of the experimental groups (exp) are indicated by gray circles. In the experimental group, the number of cells decreased significantly in all regions except the non‐contact region of the femur (P < 0.05). In the transitional region of the tibia, the number of cells at 8 weeks was significantly lower than the number at 0 and 3 days, and 1 and 2 weeks (§ P < 0.05). Significant differences in the number of chondrocytes between the control and experimental groups at the same time point are indicated (**P < 0.01, *P < 0.05).
