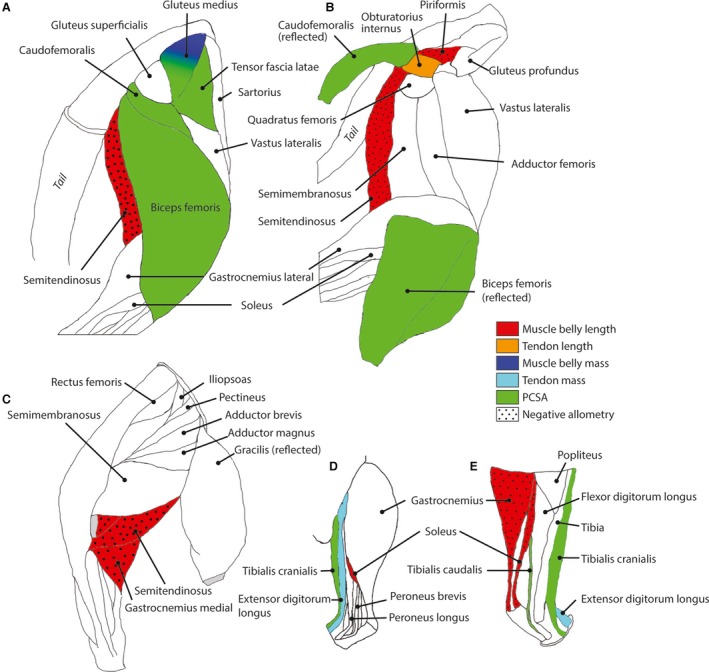
Figure 1.

Muscles displaying potential allometry (prior to phylogenetic analysis) in the studied felid species are shown in colour; others as white; for a representative right hindlimb. (A) Lateral superficial muscles of hip and knee. (B) Lateral, deeper muscles of the hindlimb. (C) Medial muscles of the thigh and shank. (D) Lateral muscles of the lower leg. (E) Medial muscles of the lower leg. Red = muscle belly length; orange = tendon length; navy blue = muscle mass; light blue = tendon mass; green = PCSA. Stippling pattern is for negative allometry. Muscles not shown: M. psoas majorum (Table 6); M. vastus intermedius (Tables 4 and 5); M. lateral digital extensor (Table 4); M. superficial digital flexor (Table 6); M. peroneus brevis (Table 2).
