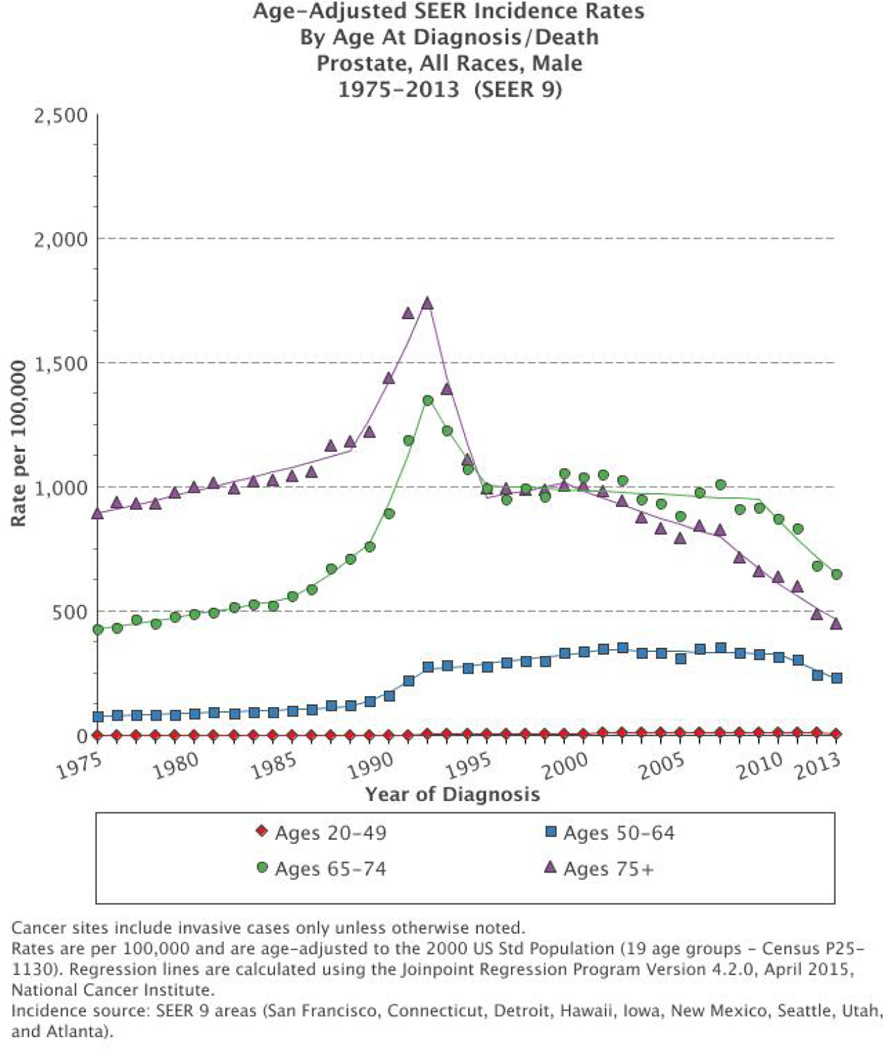
Figure 2.
Age-adjusted prostate cancer incidence rates in the Surveillance, Epidemiology and End Results (SEER) database by age at diagnosis from 1975 to 2013 in the USA. Rates are per 100,000 and age-adjusted to the 2000 US standard population. The figure is extracted with permission from the SEER Database. The figure is extracted with permission from the SEER Database. https://seer.cancer.gov

