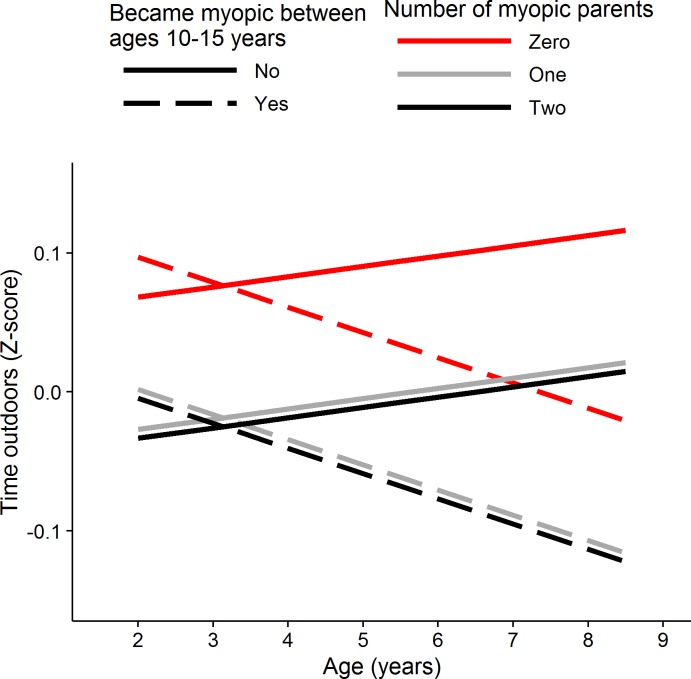
Figure 5.
Best-fit model predictions of time spent outdoors in early childhood for children who did or did not become likely myopic during later childhood. Predictions from a linear mixed model designed to account for correlated time outdoors behavior across childhood for children who became likely myopic (dashed lines) or remained likely nonmyopic (solid lines), with colors denoting the number of myopic parents (0 = red, 1 = gray, 2 = black). By design, the average time outdoors per day at each age is zero. Positive z scores correspond to more time outdoors per day, negative z scores to less time outdoors.

