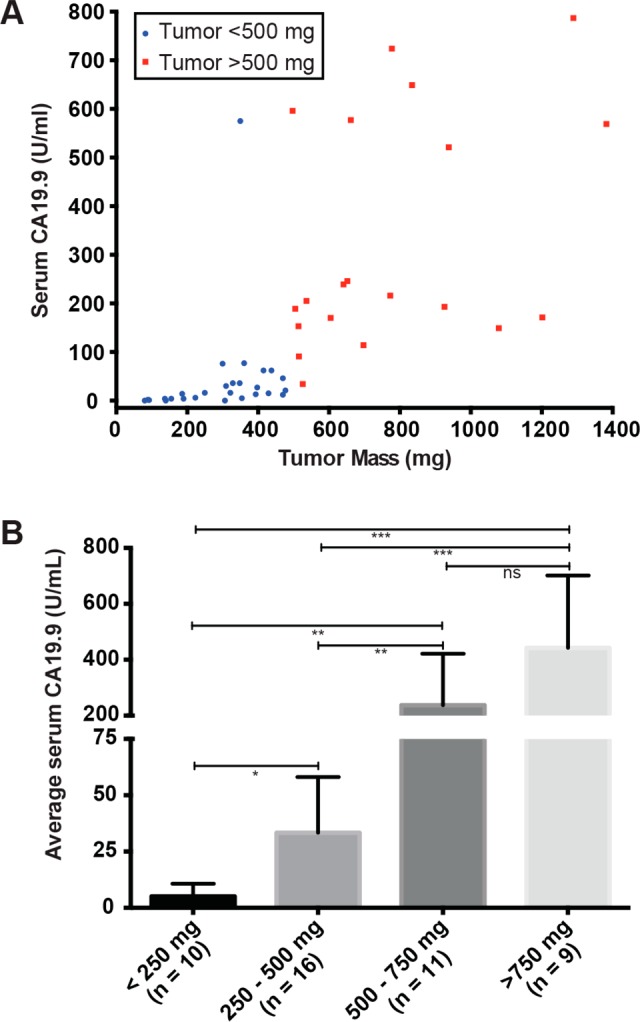
Figure 2.

Serum levels of CA19.9 in mice with Capan-2 xenografts were analyzed by ELISA indicating that larger tumor sizes lead to increased CA19.9 (A) and that there was a statistically significant difference (* = p < 0.05; ** = p < 0.001; *** = p < 0.0001) across tumors of varying size (B).
