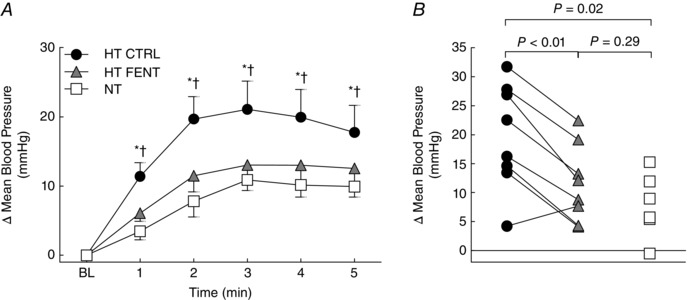
Figure 3. Blood pressure response to cycling in hypertensive and normotensive subjects .

A, responses of mean BP during each minute of cycling. HT CTRL (black circles), hypertensive subjects before fentanyl administration; HT FENT (grey triangles), hypertensive subjects after fentanyl administration; NT (white squares), normotensive subjects; BL, resting baseline. Data are the mean ± SEM. *P < 0.05 HT CTRL vs. NT. †P < 0.05 HT CTRL vs. HT FENT. B, individual mean BP change from resting baseline at the second minute of cycling. Connecting lines indicate that, except for one individual, the BP response of every hypertensive subject to cycling exercise was lower after fentanyl. These statistical comparisons had equivalent results from the first to the fifth minutes. HT CTRL (black circles), hypertensive subjects before fentanyl administration; HT FENT (grey triangles), hypertensive subjects after fentanyl administration; NT (white squares), normotensive subjects.
