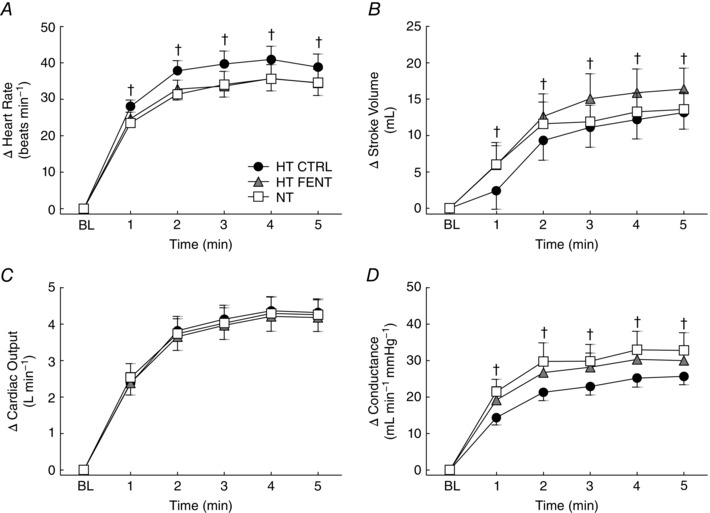
Figure 4. Cardiovascular responses to cycling in hypertensive and normotensive subjects .

Responses of heart rate (A), stroke volume (B), cardiac output (C) and total vascular conductance (D) during each minute of cycling. HT CTRL (black circles), hypertensive subjects before fentanyl administration; HT FENT (grey triangles), hypertensive subjects after fentanyl administration; NT (white squares), normotensive subjects. BL, resting baseline. Data are the mean ± SEM. † P < 0.05 HT CTRL vs. HT FENT.
