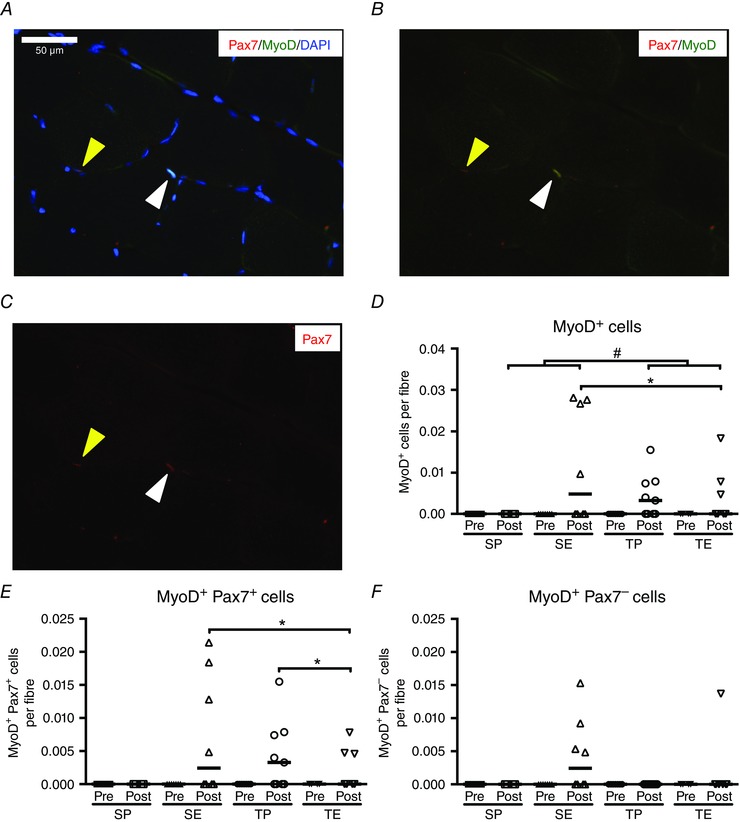
Figure 3. MyoD+ satellite cell identification pre‐ and post‐intervention period .

Representative muscle cross‐section stained for Pax7 (red, A), MyoD (green, B) and nuclei (DAPI, blue, C). One Pax7+/Myod+ cell (white cone) and one Pax7+/MyoD− (yellow cone) are identified. Scale bar = 50 μm. Quantification of MyoD+ cells (D), MyoD+/Pax7+ cells (E) and MyoD+/Pax7− cells (F) pre and post 10 weeks of sedentary placebo (SP), sedentary ESA treatment (SE), training placebo (TP) or training ESA treatment (TE). Cell content is expressed per fibre and data are presented as individual values and medians. Differences between pre and post are denoted by an asterisk (*P < 0.05). Group difference is denoted by a hash symbol (#P < 0.05).
