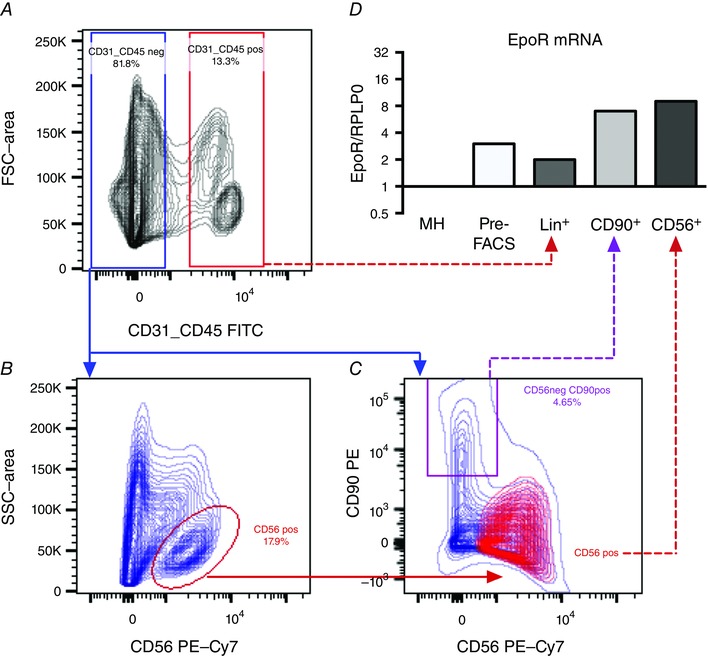
Figure 5. Epo‐R mRNA expression in adult human satellite cells .

A–C, contour plots indicating the FACS strategy are shown. Three cell populations were identified; CD56+ cells (satellite cells) [CD56+/Lin (CD45/CD31)−], CD90+ cells (CD90+/Lin−) and Lin+ (CD45+/CD31+). As shown in (C), the CD56+ and CD90+ cell populations were largely negative for CD90 and CD56, respectively. In addition to FACS sorted cells, Epo‐R expression was determined in whole muscle homogenate (MH) and a pre‐FACS sample. mRNA expression levels of Epo‐R (D) were quantified and normalized to mRNA expression of ribosomal protein large P0 (RPLP0). Each target was expressed relative to whole muscle homogenate (MH). Data (n = 1) are shown on a log2 scale.
