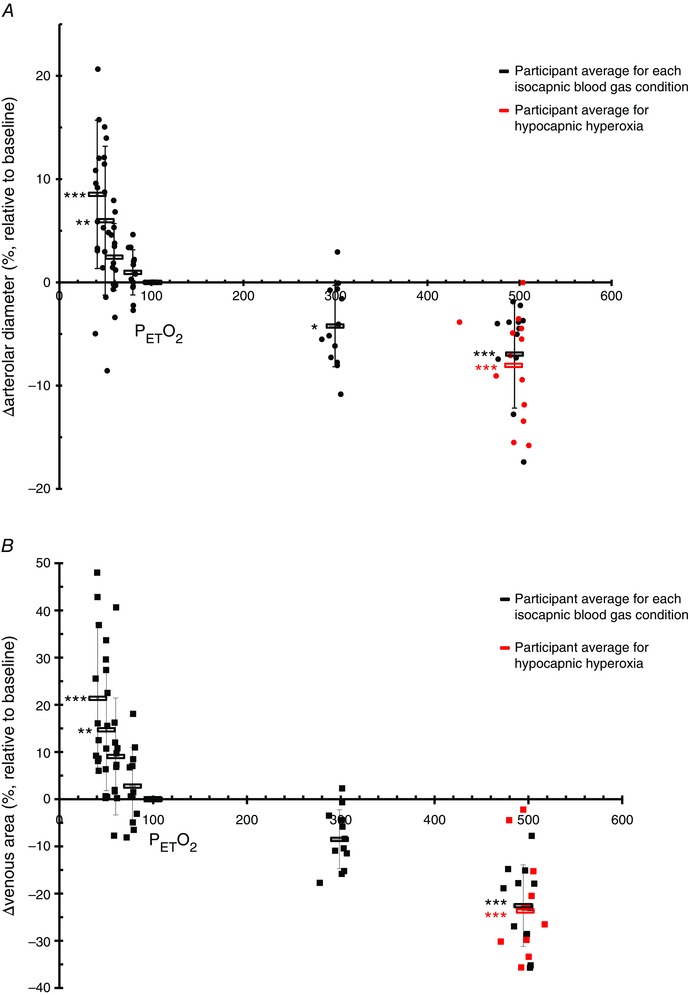
Figure 2. Change in arteriolar diameter and venous area .

Change in arteriolar diameter (A) and venous area (B) measured with the CLBF and RTVue, respectively, as a percentage relative to standardized baseline (38 mmHg , 100 mmHg ) over seven isocapnic (38 mmHg ) changes in oxygen (40–500 mmHg ). Each black circle (A, CLBF) and square (B, RTVue) represents a participant for a single blood gas condition. The average of each isocapnic stage is shown as a black rectangle. The additional hypocapnic hyperoxic stages are delineated by red circles (A) or red squares (B), with each point representing a single participant; the red rectangle displays the average of this stage. *P < 0.05, **P < 0.01, ***P < 0.001.
