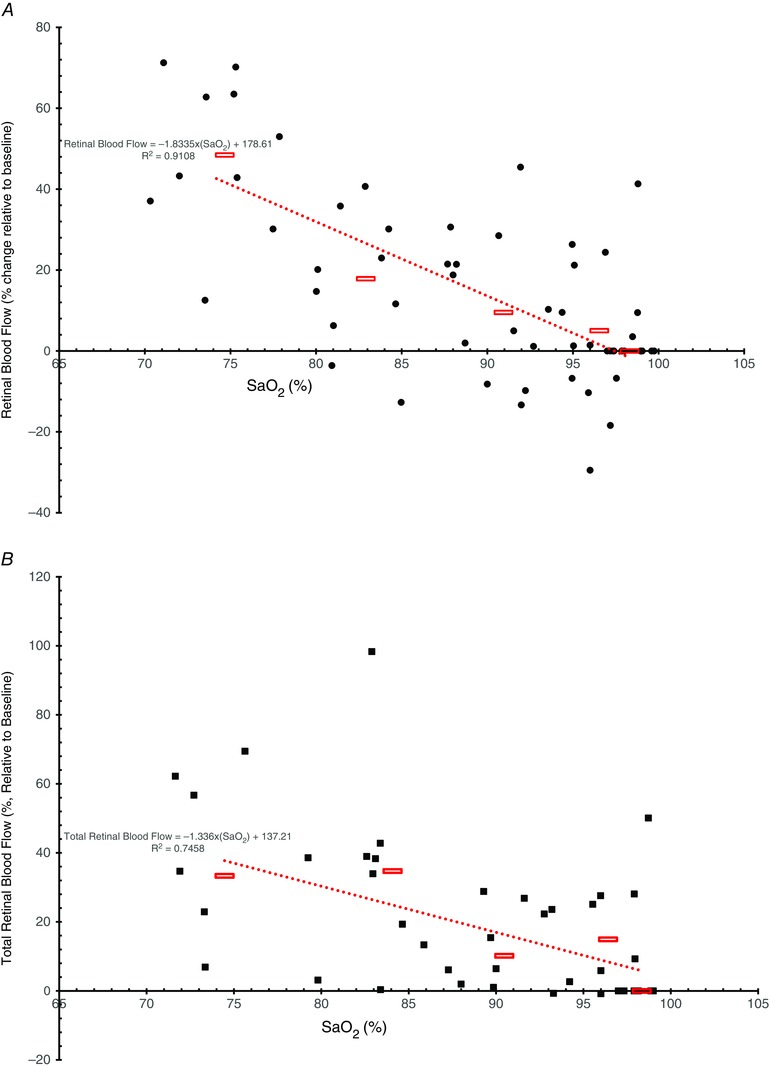
Figure 4. Retinal blood flow .

Retinal blood flow measured with the CLBF (visit 1, A) and total retinal blood flow measured with the RTVue (visit 2, B) as a percentage change relative to standardized baseline (SaO2 = 98%) vs. arterial oxygen saturation (SaO2) over four hypoxic stages (SaO2 = 74–96%). Each black circle (A, CLBF) and square (B, RTVue) represents a participant during one blood gas condition. Average blood flow changes for all participants in a given hypoxic stage are shown as red rectangles. The red dotted line shows the line of best fit for the average retinal blood flow change with an r 2 value of 0.9108 for CLBF (A) and 0.7458 for RTvue (B).
