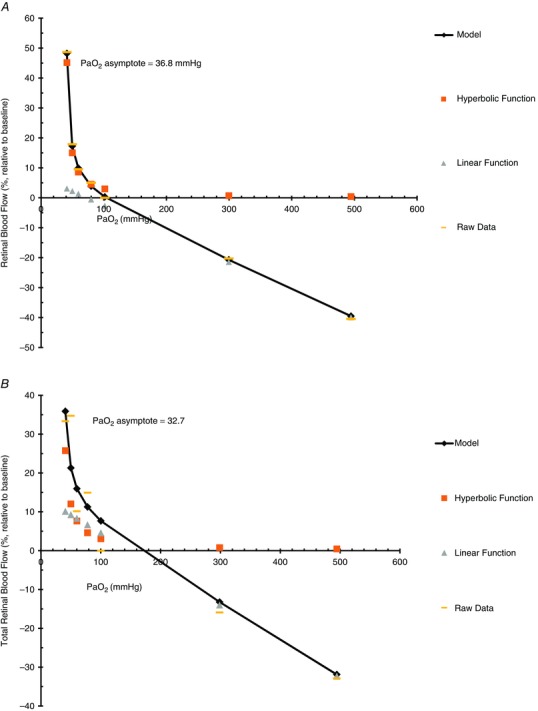
Figure 6. Combined hyperbolic and linear function for retinal blood flow and total retinal blood flow .

Model delineating a combined hyperbolic and linear function for retinal blood flow measured with CLBF (A) and total retinal blood flow measured with the RTVue (B) during seven isocapnic (38 mmHg ) stages of (40, 50, 60, 80, 100, 300, 500 mmHg). The addition of series 2, the hyperbolic function, and series 3, the linear fit, gives the model, series 1. Series 4 shows the mean raw data.
