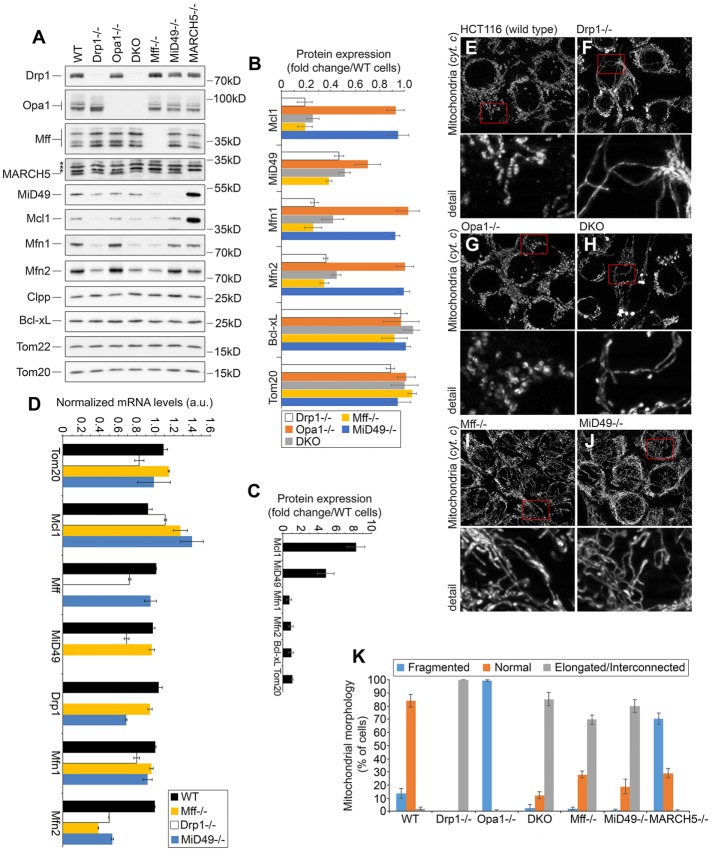
FIGURE 4:
Role of Drp1 and Mff in control of the OMM proteostasis. (A) Total cell lysates obtained from wild type and HCT116-based Drp1−/−, Opa1−/−, DKO (Drp1−/−/Opa1−/−), Mff−/−, MiD49−/−, and MARCH5−/− were analyzed by Western blot as indicated. (B, C) Fold changes of protein levels in knockout cells listed in A were estimated. Protein levels were plotted after normalization, with respective protein levels in wild-type cells set at 1. (C) Relative levels of specified proteins in MARCH5−/− cells. Data represent mean ± SD of three or four independent experiments. (D) mRNA expression of indicated genes in wild-type, Drp1−/−, Mff−/−, and MiD49−/− HCT116 cells was determined using qRT-PCR. Fold induction was calculated by the absolute quantification method. A standard curve was made for reference gene by serial dilutions of genomic DNA from 100 to 3.125 ng. Data represent mean ± SD; n = 3. (E–J) Wild-type (E), Drp1−/− (F), Opa1−/− (G), DKO (Drp1−/−/Opa1−/−; H), Mff−/− (I), and MiD49−/− (J) HCT116 cells were immunostained with anti–cytochrome c antibody to reveal mitochondria and imaged using structured illumination microscopy. Cells were divided into three categories based on mitochondrial morphology, as described in Figure 2I. Typical images of respective cells. (K) Mitochondrial morphologies in cell types shown in E–J were scored using blinded cell counting. Data represent mean ± SD of three independent counts of 150 cells/condition.

