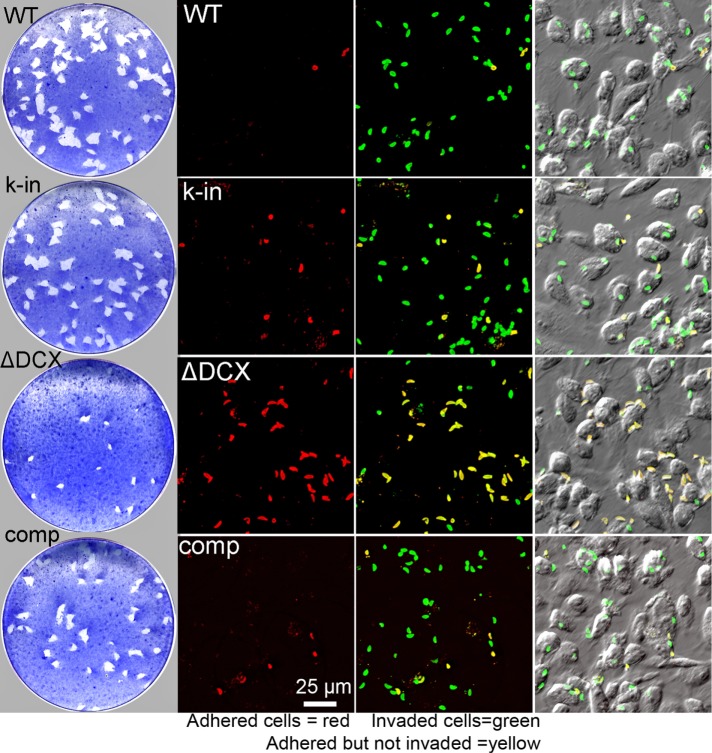
FIGURE 6:
Loss of TgDCX dramatically slows growth and hinders host-cell invasion. Left, plaque assay (Materials and Methods). Top to bottom, wild type (WT), parental (RHΔku80Δhx); k-in, mCherryFP-TgDCX knock-in; ΔDCX, knockout parasites (TgDCX null); comp, knockout parasites complemented with TgDCX-EGFP expressed under control of the T. gondii α-tubulin promoter. The TgDCX-knockout parasites form many fewer and much smaller plaques than the WT, knock-in, or complemented knockout lines. Right, host-cell invasion assay (Materials and Methods). The red channel shows parasites outside the host cell, that is, those that adhered to the host cells but failed to invade. Next the red channel has been overlaid on a green channel that marks all parasites, inside as well as outside the host cell. In this overlay, parasites that invaded the host cell are green, and parasites that failed to invade are yellow. Only a small fraction of the TgDCX-knockout parasites are able to invade. Red and green fluorescence channels are both overlaid on a DIC image of the same field in the last column.

