FIGURE 2:
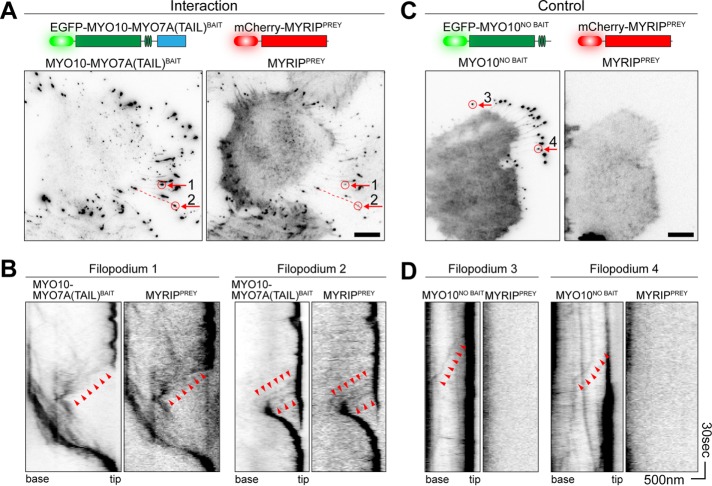
MYO10 can be harnessed to traffic bait–prey complexes in live cells. Visualization of bait and prey molecule trafficking in live HeLa cells by time-lapse TIRFM. Imaging was performed at 37°C. Fluorescence images have been uniformly inverted. (A) In HeLa cells expressing MYO10-MYO7A(TAIL)BAIT (left) and MYRIPPREY (right), both molecules accumulate at filopodial tips. A single frame from the time-lapse is shown. Filopodia selected for kymographs are indicated by red arrows. (B) Kymographs from A reveal molecular trafficking along filopodia. Bait and prey molecules accumulate at the filopodial tips, which are visible as a dark vertical line. Dim puncta of MYO10-MYO7A(TAIL)BAIT and MYRIPPREY move synchronously toward the filopodial tip (anterograde, arrowheads). Retrograde flow of bait and prey molecules (toward the cell body) is also observed. (C) MYO10NO BAIT accumulates at filopodial tips but does not traffic MYRIPPREY molecules. This control experiment demonstrates that trafficking of MYRIPPREY is critically dependent on the MYO7A(TAIL) moiety being fused to the myosin motor. (D) Kymographs from C confirm that MYRIPPREY molecules are not trafficked by MYO10NO BAIT. Anterograde (arrowheads) trafficking of MYO10NO BAIT is observed. Filopodia 3 and 4 are indicated by arrows in C. Horizontal scale bars: 10 µm (A and C); 500 nm (B and D); vertical scale bars: 30 s (B and D), with the bottom of each kymograph representing 0 s.

