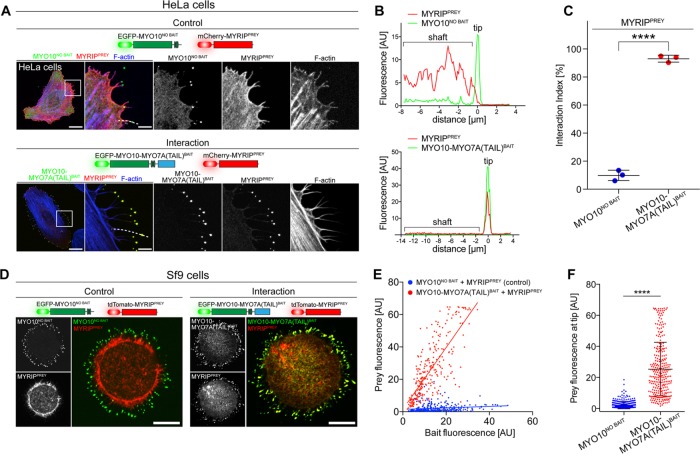
FIGURE 3:
Quantifying PPIs by NanoSPD. NanoSPD concentrates bait–prey complexes into a nanoscopic volume at filopodial tips, providing noise-free fluorescence enhancement and a defined location for imaging away from the cell body. (A) In fixed HeLa cells expressing MYO10-MYO7A(TAIL)BAIT and MYRIPPREY, both bait and prey coaccumulate at filopodial tips. MYO10NO BAIT does not traffic MYRIPPREY in the control, confirming the interaction and that MYRIPPREY cannot traffic autonomously. Scale bars: 20 µm; 5 µm (magnified boxed regions). (B) Using SCA to detect molecular interactions. Pearson’s r coefficient is calculated along the filopodial shaft (dotted line, A) to measure bait and prey fluorescence correlation. The likelihood that the observed correlation can occur by random chance is estimated by bootstrapping (see Materials and Methods). (C) SCA reveals a significantly higher interaction index (t test) when MYRIPPREY is coexpressed with MYO10-MYO7A(TAIL)BAIT (n = 292 filopodia total) than when MYRIPPREY is coexpressed with MYO10NO BAIT (n = 264 filopodia total). Each data point is the average interaction index from a single experiment (three independent determinations). Data are mean ± SD. (D) NanoSPD can be used in nonmammalian Sf9 insect cells that produce large numbers of filopodia. In fixed Sf9 cells, MYRIPPREY accumulates with MYO10-MYO7A(TAIL)BAIT at filopodial tips but not when coexpressed with MYO10NO BAIT. Scale bar: 10 µm. (E) Using ICA to detect PPIs in Sf9 cells. Scatter plot of bait (x-axis) and prey (y-axis) fluorescence at individual filopodia tips (from three independent determinations). MYRIPPREY fluorescence is linearly correlated with MYO10-MYO7A(TAIL)BAIT fluorescence, unlike cells expressing MYO10NO BAIT. (F) Bar graph of MYRIPPREY fluorescence intensities from E. Coexpression with MYO10-MYO7A(TAIL)BAIT significantly increases the average prey fluorescence intensity at filopodial tips, compared with MYO10NO BAIT (Mann-Whitney U-test). Data are mean ± SD. ****, p < 0.0001.

