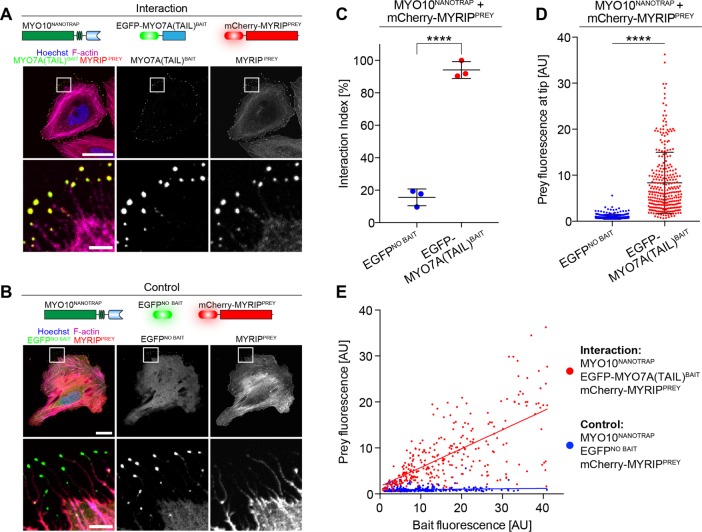
FIGURE 7:
Simplified NanoSPD 2.0 assays using the GFP-nanotrap. NanoSPD 2.0 uses MYO10HMM fused to the GFP-binding nanotrap (MYO10NANOTRAP) to capture EGFP-tagged bait proteins and transport them along filopodia. (A) Image of fixed HeLa cells expressing nonfluorescent MYO10NANOTRAP, EGFP-MYO7A(TAIL)BAIT, and mCherry-MYRIPPREY. Both bait and prey robustly accumulate at filopodial tips (magnified panels shown below). (B) mCherry-MYRIPPREY does not accumulate at filopodial tips (magnified panels shown below) when coexpressed with mCherry-MYO10NANOTRAP and EGFP (EGFPNO BAIT). This confirms that the GFP-nanotrap does not bind mCherry-MYRIPPREY directly. Scale bars: 25 μm; 5 μm (magnified regions). (C) SCA of data from A and B shows a significantly higher interaction index (t test) in the presence of EGFP-MYO7A(TAIL)BAIT vs. EGFPNO BAIT. Data are mean ± SD with each data point representing the average interaction index from a single experiment. (D) ICA of data from A and B reveals the significant increase (Mann-Whitney U-test) of mCherry-MYRIPPREY fluorescence at filopodial tips in the presence of EGFP-MYO7A(TAIL)BAIT vs. EGFPNO BAIT. Data are mean ± SD with each data point representing a single filopodium. (E) Bait (x-axis) vs. prey (y-axis) scatter plot of fluorescence at filopodial tips from D. Each data point represents a single filopodium. ****, p < 0.0001; all data are from three independent experimental determinations (n = 285–295 filopodia total).

