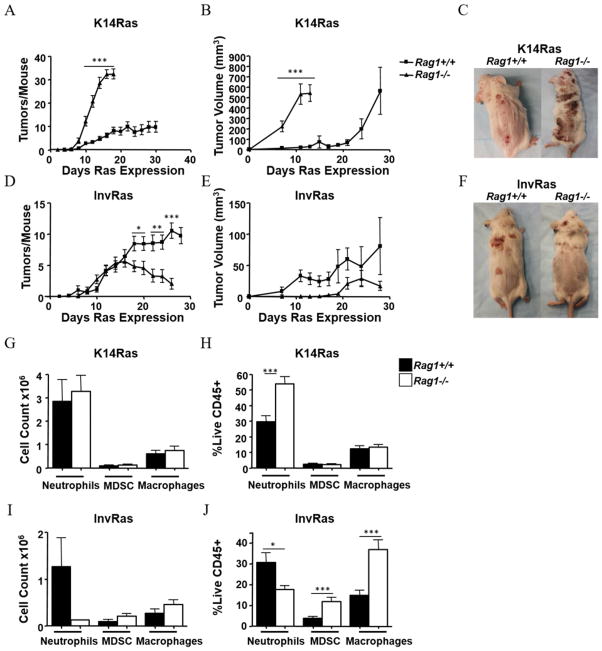
Figure 2. Lymphocytes have opposing effects on tumor development dependent on tissue compartment of H-RasV12G expression.
Tumor counts (A), tumor volume (B), and representative gross phenotype at end stages (C) of K14RasRag1+/+ and K14RasRag1−/− mice at indicated days after Ras induction. (A: K14RasRag1+/+ n = 45, K14RasRag1−/− n = 28. B: n = 8 per group). Tumor counts (D) Tumor Volume (E) and representative gross phenotype at end stages (F) of InvRasRag1+/+ and InvRasRag1−/− mice at indicated days after Ras induction. (D: InvRasRag1+/+ n = 30, InvRasRag1−/− n = 27. E: InvRasRag1+/+ n = 10, InvRasRag1−/− n = 6). (G and H) Analysis of tumor-infiltrating myeloid cell counts (G), and myeloid percentages (H) in K14RasRag1+/+ or K14RasRag1−/− mice. (G: K14RasRag1+/+ n = 12, K14RasRag1−/− n = 12. H: K14RasRag1+/+ n = 30, K14RasRag1−/− n = 15). (I and J) Analysis of tumor-infiltrating myeloid cell counts (I), and myeloid percentages (J) in InvRasRag1+/+ or InvRasRag1−/− mice. (I: InvRasRag1+/+ n = 12, InvRasRag1−/− n = 4. J: InvRasRag1+/+ n = 21, InvRasRag1−/− n = 18). Counts were determined using a Cellometer Auto T4 Cell Viability Counter (Nexcelom Bioscience), and quantified using FlowJo software.

