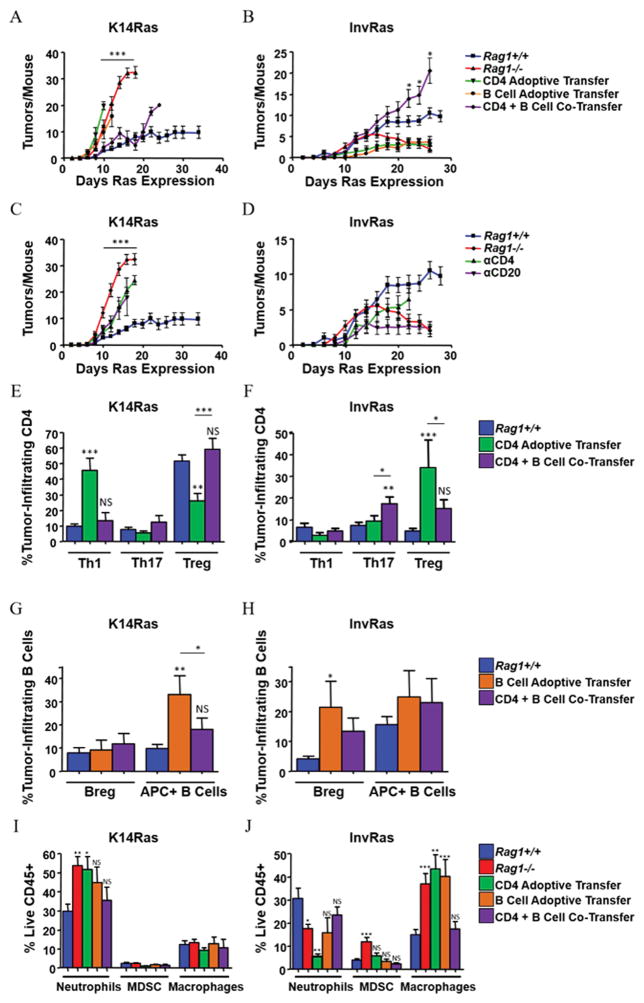
Figure 3. CD4 T Cells and B Cells cooperate in K14Ras and InvRas mice to produce protective and tumor-promoting immune responses, respectively.
(A and B) Tumor counts in adoptively transferred K14RasRag1−/− (A) and InvRasRag1−/− (B) mice at indicated days after Ras induction. K14RasRag1+/+, K14RasRag1−/−, InvRasRag1+/+, and InvRasRag1−/− mice from previous figures included as reference. (A: n = 45, 28, 12, 13, and 18. B: n = 30, 27, 12, 12, and 12). (C and D) Tumor counts in CD4 and CD20-depleted mice of K14Ras (C) and InvRas (D) mice at indicated days after Ras induction. K14RasRag1+/+, K14RasRag1−/−, InvRasRag1+/+, and InvRasRag1−/− mice from previous figures included as reference. (C: n = 45, 28, 12, and 13. D: n = 35, 27, 12, and 18). (E and F) Analysis of tumor-infiltrating CD4 percentages in K14Ras (E) and InvRas (F) adoptive transfer experiments into Rag1−/− mice. (E: n ≥ 11 for all groups. F: n ≥ 7 for all groups). (G and H) Analysis of tumor-infiltrating B cell percentages in K14Ras (G) and InvRas (H) adoptive transfer experiments into Rag1−/− mice. (G: n ≥ 6 for all groups. H: n ≥ 6 for all groups). (I and J) Analysis of tumor-infiltrating myeloid percentages in K14Ras (I) and InvRas (J) adoptive transfer experiments into Rag1−/− mice. (I: n ≥ 11 for all groups. J: n ≥ 6 for all groups). Unless otherwise indicated, significance was calculated compared to Rag1+/+ mice.

