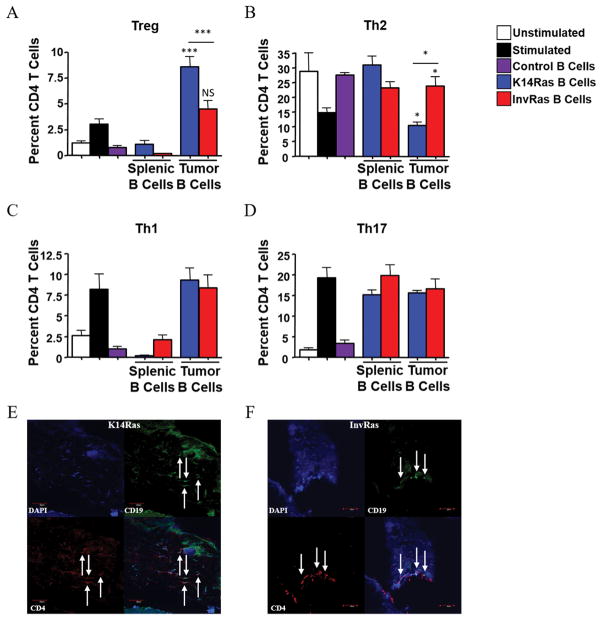
Figure 4. Direct contact between CD4 T cells and tumor-conditioned B cells is essential for CD4 T cell polarization and phenotype.
(A–D) Analysis of CD4 percentages following 7-day coculture with control splenic B cells from healthy mice, splenic B cells from tumor-bearing K14Ras or InvRas mice, or B cells from tumor tissue of K14Ras or InvRas mice, examining Treg (A), Th2 (B), Th1 (C), and Th17 (D) cells. Unstimulated and stimulated controls n = 18 (6 biological replicates × 3 technical replicates), Control B cells n = 9 (3 biological replicates × 3 technical replicates), K14Ras splenic B cells n = 6 (3 biological replicates × 2 technical replicates), InvRas splenic B cells n = 9 (3 biological replicates × 3 technical replicates), Tumor B cells minimum n = 24 (8 biological replicates × 3 technical replicates) maximum n = 36 (12 biological replicates × 3 technical replicates). Unless otherwise indicated, significance was calculated compared to stimulated control group. (E and F) Immunofluorescence examination of CD4 (Red), CD19 (Green), DAPI (Blue), and composite of representative K14Ras (E) and InvRas (F) tumors. Arrows indicate CD4 and B Cells in direct contact. Magnification: 10x.

