
Figure 3. Basal Cell Carcinoma: Correlation of pathology throughout the BCC specimen with epi-fluorescence imaging.
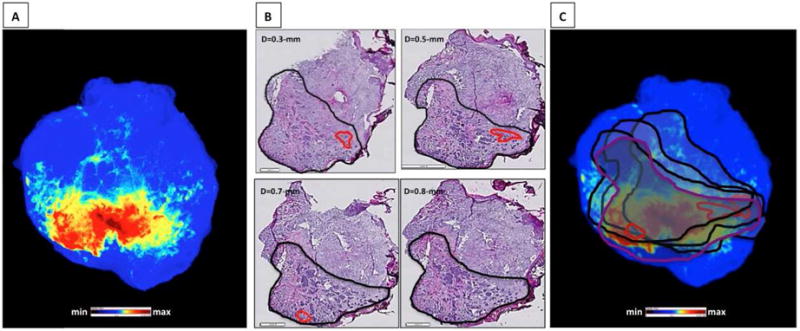
A, Cy5-fluorescent image of skin sample pre-treated with GB119. B, En face section histology at different depth; bold contour markings = pathologist H&E mapped cancer perimeter. C, Overlay of contour markings on the fluorescence image of the skin sample; red contours = tissue inflammation. Scale bars (H/E) – 1-mm and 2-mm (large).