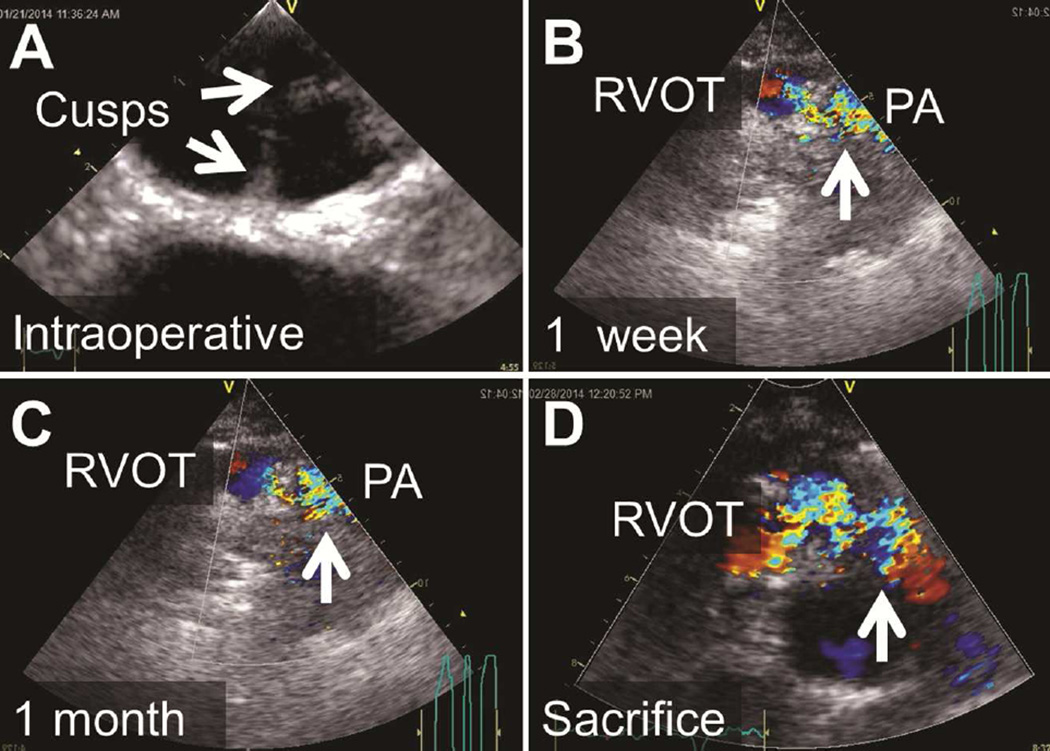
Figure 5.
Images of Echocardiography of the Pulmonary Valve in Vivo. A, Immediately postoperatively; B, at 1 week postimplantation; C, at 1 month postimplantation; and, D, immediately prior to sacrifice. Note progressively worsening turbulent flow (arrows), starting in the right ventricular outflow tract (RVOT) just below the xenograft and extending into the main pulmonary artery (PA). Increasing gradients were noted by continuous wave Doppler consistent with progressive xenograft valve stenosis.

