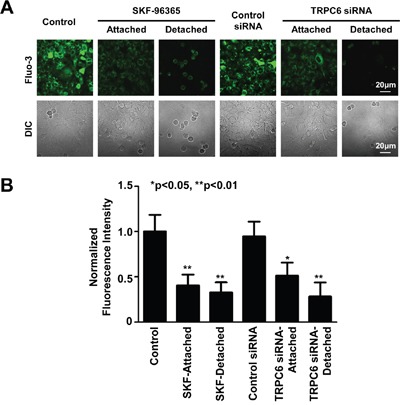
Figure 4. Inhibition of TRPC6 reduces intracellular Ca2+.

A. Representative confocal microscopy fluorescent and DIC images of control A549 cells, still attached cells even after treatment with SKF-96365, or SKF-96365- and TRPC6 siRNA-induced detached cells. B. Summary plots of relative fluorescence intensity after each treatment. Data were from four separate experiments; all shows similar results. The fluorescence intensity in each treatment was normalized according to the mean of fluorescence intensity under control conditions which was set to 100%.
