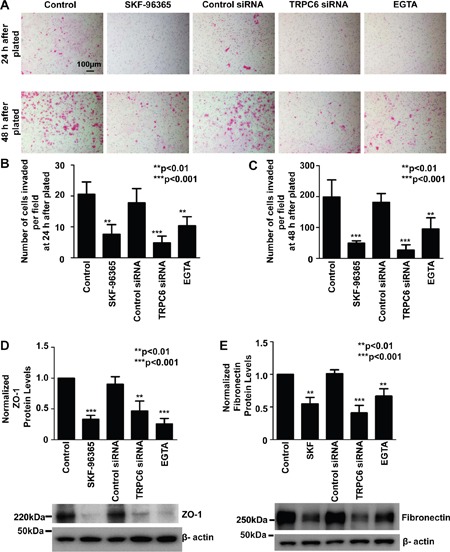
Figure 6. Inhibition of TRPC6 reduces A549 cell invasion and decreases expression of both ZO-1 and fibronectin, probably by reducing intracellular Ca2+.

A. Representative images of cells passed through the membrane, shown in purple. A549 cells were under control conditions or treated for 24 h or 48 h with 5 μM SKF-96365, control siRNA, or TRPC6 siRNA, or for 6 h with 1 mM EGTA. Summary plots of the number of invasive cells under each condition for 24 h B. or 48 h C. per field (counted using 15 microscopy fields from three separate experiments). D and E. show normalized protein levels of either ZO-1 or fibronectin in A549 cells from three separate Western blot experiments, using β-actin as a loading control. Representative Western blot data are shown below the summary plots.
