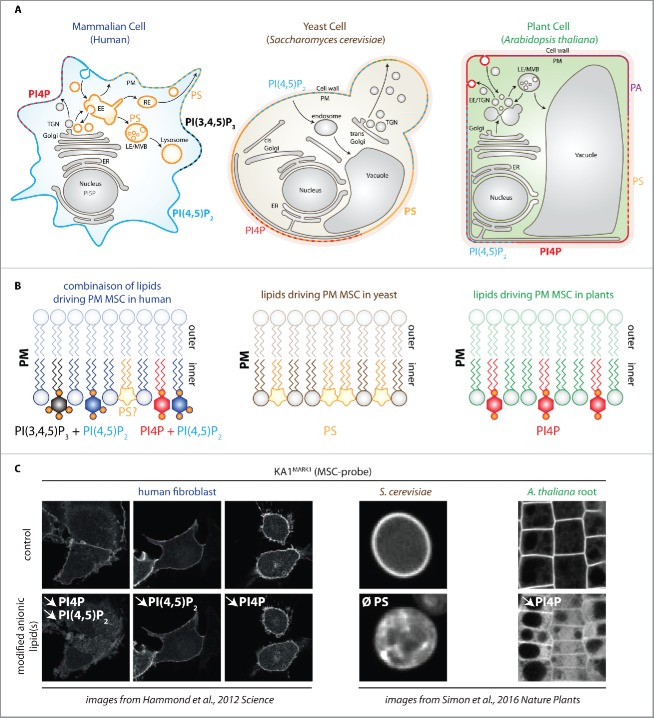
Figure 2.
Contribution of different anionic phospholipids in plasma membrane surface charge. (A) schematic representation of human, yeast and plant cells. Anionic phospholipids that localize at the cell surface are indicated for each cell type. For clarity, PI3P, PI5P and PtdIns(3,4)P2 have been omitted, although they have been shown to localize at the plasma membrane in animal cells at very low quantity and/or upon specific stimuli.11 The localization of PS in plasma membrane-derived organelles is indicated by the orange color. Note that for practical purposes, dashes indicate the presence of several lipid species on the same membrane, however, this does not mean that they are necessarily organized in discrete domains. (B) schematic representation of the anionic lipids required for plasma membrane MSC in mammals (left), yeast (middle) and plants (right). Note that in human, PtdIns(4,5)P2 acts redundantly with either PtdIns(4)P or PtdIns(3,4,5)P3. (C) confocal pictures showing the localization of the KA1 domain of MARK1 in human fibroblast cells (left), S. cerevisiae (middle) and A. thaliana root epidermis (right). KA1 is a domain that interacts with all negatively charged lipids and therefore acts as a sensor of membrane electrostatics (so called MSC-probe). Top panels are control cells and bottom panels show conditions in which anionic phospholipids have been genetically or chemically perturbed. The targeted lipid(s) is indicated in white (downward pointing arrows indicate the reduction in the given lipid content and Ø total absence in the lipid in the Δcho1 yeast mutant). Note that KA1MARK1 localizes at the cell surface in mammals, yeasts and plants, but that this strict plasma membrane localization relies on different anionic phospholipid in these cells. EE, early endosome; LE, late endosome; RE, recycling endosomes; TGN, trans-golgi network; ER, endoplasmic reticulum; MSC, membrane surface charge. Pictures of fibroblasts are from Hammond et al.9 and pictures from yeast and plants are from Simon et al.8 The cartoon representing the cell from the top left cornel is inspired from Jean and Kiger 2012 and adapted by permission from Macmillan Publisher Ltd: [NATURE REVIEW MOLECULAR CELL BIOLOGY], ref. 12 copyright (2012).

