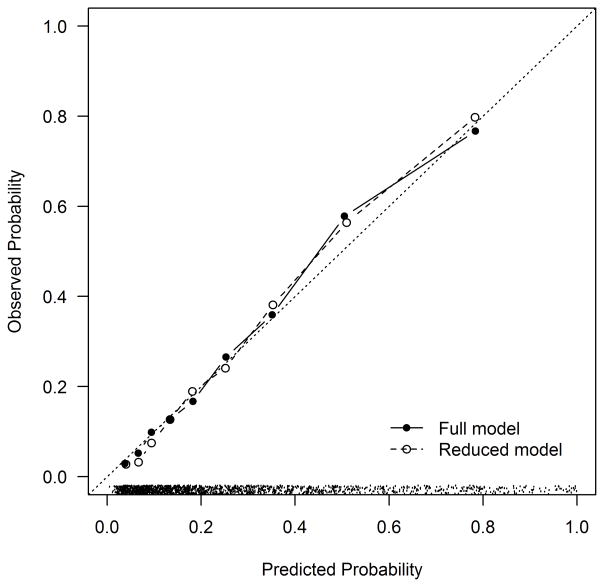
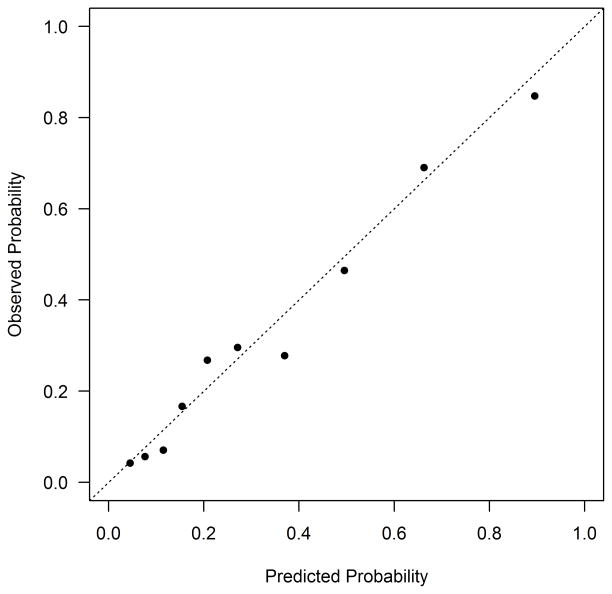
Figure 1. Calibration Plot for the Mortality Prediction Model in TRIUMPH (a) and PREMIER (b).
(a) TRIUMPH Internal Validation: Calibration slope 0.92 (full model) and 0.92 (reduced model). The dots at the bottom of the figure indicate the distribution of predicted risks. (b) PREMIER External Validation: Calibration slope 0.92.


