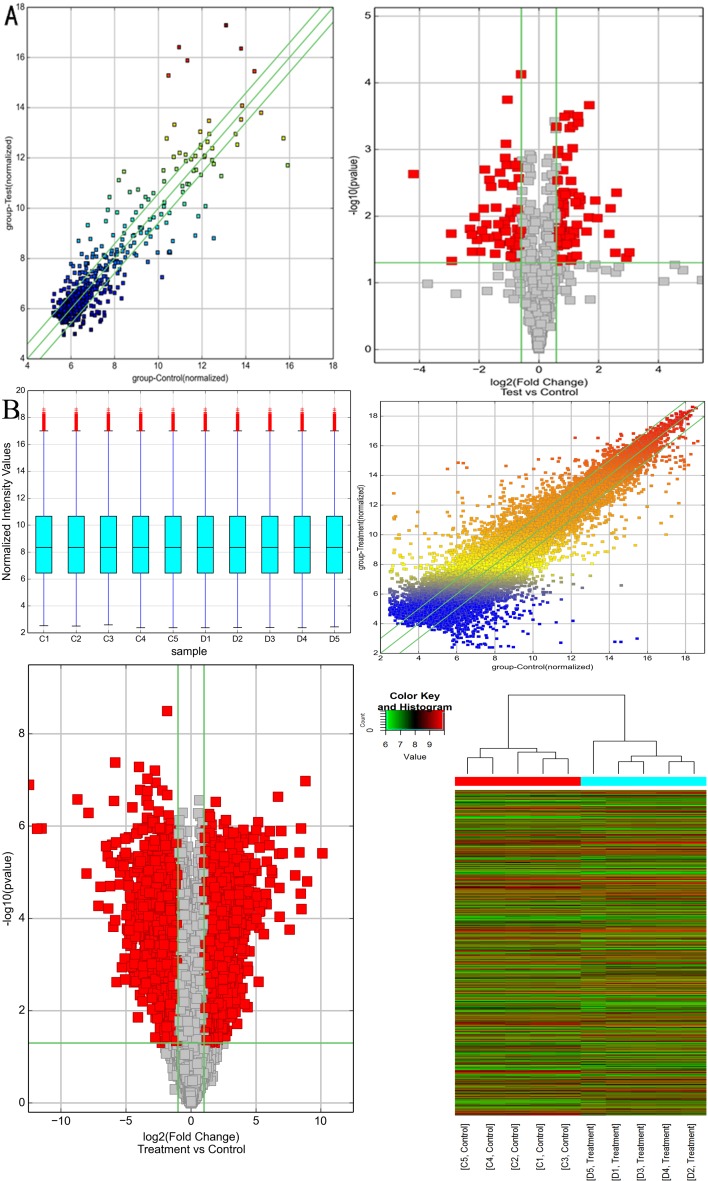
Figure 2. Bioinformatics analysis of differentially expressed circRNAs and mRNAs in NASH mice model.
A. Scatter plot (left panel) and volcano plot (right panel) showed the distributions of circRNAs in more direct way. B. Box plot (left upper panel), scatter plot (right upper panel), volcano plot (left lower panel) and heat map (right lower panel) showed the distributions of mRNAs in more direct way. After normalization, the distributions of log2 ratios among samples were nearly the same. The values of the X- and Y-axes in the scatter plot were the averaged normalized signal values of the group (log2 scaled). The green lines in scatter plot and volcano plot represent the default significant fold change (2.0). Hierarchical cluster analysis (heat map) of microarray data was used to assess the significant expression of mRNAs when comparing NASH with control. Red and green denoted high and low expression, respectively. Each RNA was represented by a single row of colored boxes and each sample was represented by a single column.

