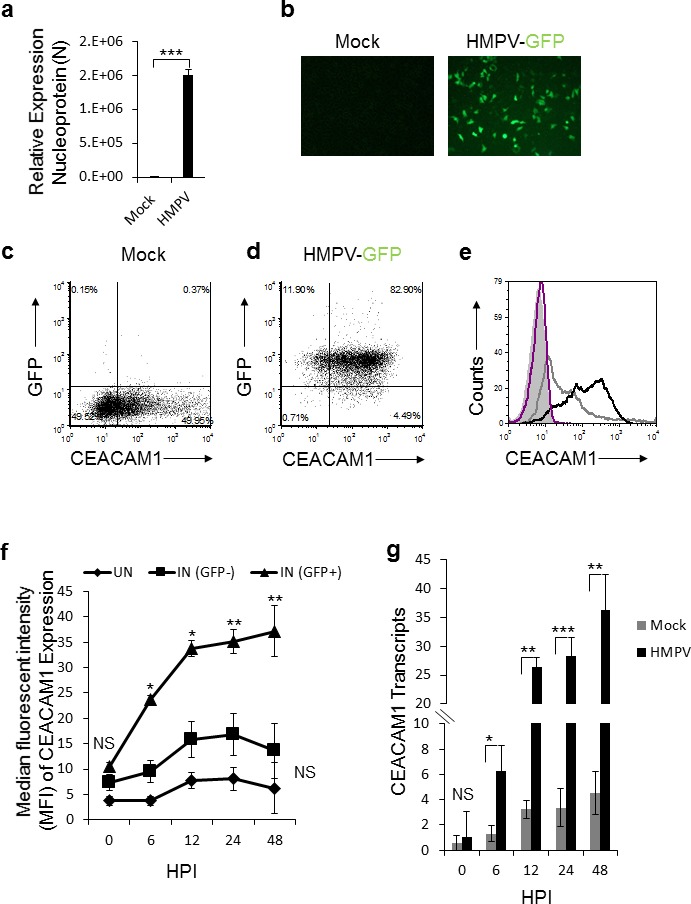
Figure 1. Expression of CEACAM1 in A549 cell line following HMPV infection.

a. qRT-PCR of the HMPV nucleoprotein (N) gene of HMPV in A549 infected cells (HMPV). The expression of nucleoprotein N in HMPV infected cells was determined relative to mock treated cells (Mock), whose expression level was set as 1. b. Fluorescent microscopy of mock treated (Mock) and A549 cells infected with the recombinant HMPV expressing GFP protein (HMPV-GFP). c.-d. Dot plots of CEACAM1 staining and GFP expression (indicative of virus infection) of mock (c) and HMPV-infected A549 cells (d). e. FACS analysis of CEACAM1 expression shown in (c and d) on the mock treated A549 cells (empty gray histogram) and on HMPV-infected A549 cells (empty black histogram), at 48h post infection. The filled gray histogram and the empty purple histogram represent the staining of the mock treated and infected A549 cells with control antibody, respectively. f. The expression of CEACAM1 was monitored on infected cells (IN (GFP+), on the uninfected cells that were present in the same culture IN (GFP-) and on parental A549 cells that were mock-treated (UN). The expression of CEACAM1 is presented as median fluorescent intensity (MFI) and is shown at various hours post infection (HPI). g. Real time PCR quantification of CEACAM1 expression on the mock-treated (Mock) and the HMPV infected cells (HMPV) during the indicated time points (HPI). NS, nonsignificant. Values are shown as means ± SEM. The figure shows data from two experiments combined. ***p <0.01,**p <0.03, *p < 0.05.
