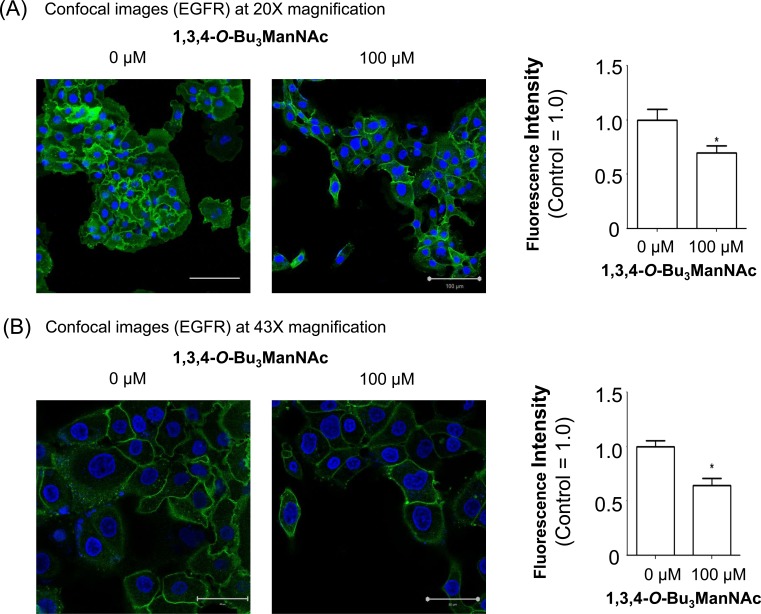
Figure 3. Confocal imaging of EGFR in SW1990 cells treated with 1,3,4-O-Bu3ManNAc.
The treated cells, in comparison with untreated controls, were imaged at (A) 20X and (B) 43X magnifications after being fixed and stained with Alexa Fluor-488 conjugated EGFR mAb (green) and DAPI (blue). Quantification of mAb staining, normalized to DAPI, showed a decrease in surface localized EGFR when SW1990 cells were treated with 100 mM 1,3,4-O-Bu3ManNAc as shown in the bar graphs. Each experiment includes at least three biological replicates and the fluorescence intensity of Alexa Fluor-488 and DAPI were quantified using Image J with the resulting data expressed as the mean value +/− standard error of the mean (SEM). Asterisks (*) indicate a p value of < 0.05. Scale bars represent 100 μm and 50 μm, respectively for Panels A and B.

