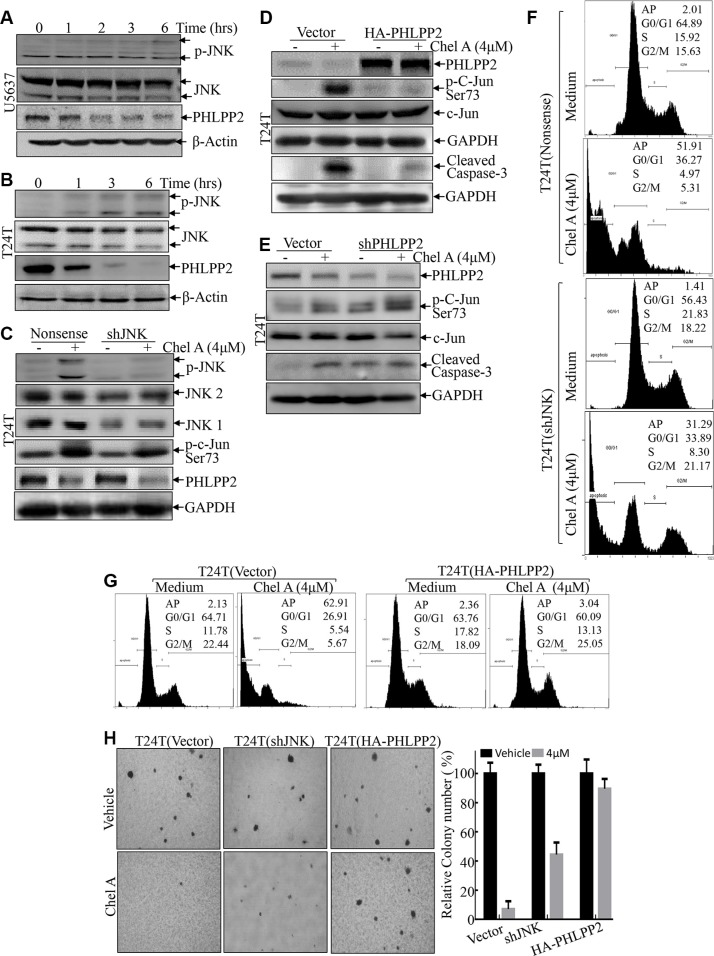
Figure 4. PHLPP2 mediates JNK and c-Jun phosphorylation.
(A and B) After synchronization, T24T and U5637 cells were treated with Chel A at 4 μM for the time points indicated. (C and D) T24T cells that were stably transfected with sh-JNK1&2, or HA-PHLPP2 plasmids were seeded into the wells of 6-well plates. After synchronization, the cells were treated with or without 4 μM Chel A for 6 hrs. The cells were then extracted and the cell extracts were subjected to Western Blotting with the indicated antibodies. (E) T24T cells that were stably transfected with shPHLPP2 plasmids or its control vector were seeded into the wells of 6-well plates. After synchronization, the cells were treated with or without 4 μM Chel A for 6 hrs. The cells were then extracted and the cell extracts were subjected to Western Blotting with the indicated antibodies. (F and G) The stable transfectants T24(vector) and T24T(sh-JNK1&2), T24T(vector) and T24T (HA-PHLPP2) cells were treated with Chel A as indicated for 24 hrs, and the cells were then fixed and subjected to cell cycle analysis by flow cytometry. The results represent one of three independent experiments. (H) T24(vector), T24T(sh-JNK1&2) and T24T(HA-PHLPP2) cells were seeded in soft agar as described under “Materials and Methods”. Representative images of colonies of these three cells in soft agar assay without or with Chel A at 4 μM were visualized under microscope and only colonies with over 32 cells were counted. Colonies are expressed as mean ± SD. from five assays of three independent experiments. The relative rate of inhibition is from the number of colonies from the Chel A treated group, normalized by the number of colonies in the control group.

