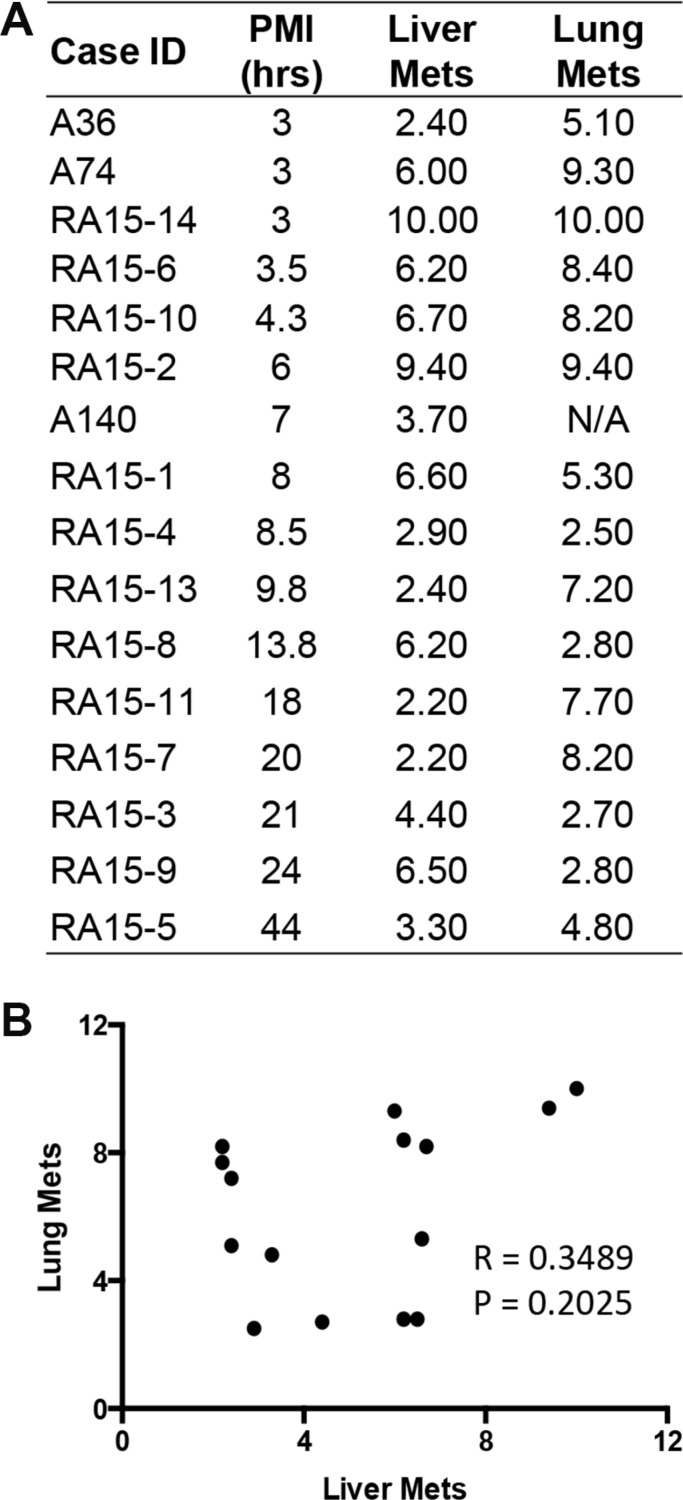
Figure 6. RNA integrity in patient-matched liver metastases and lung metastases.
(A) Numbers listed are the corresponding RIN value for each individual tissue. N/A, data not available due to low RNA yield. (B) Scatter plot was generated by plotting RIN values from liver metastases against that from lung metastases. Pearson r and p values were from correlation analysis.

