
Figure 2. HER2 status inversely correlates with autophagic activity.
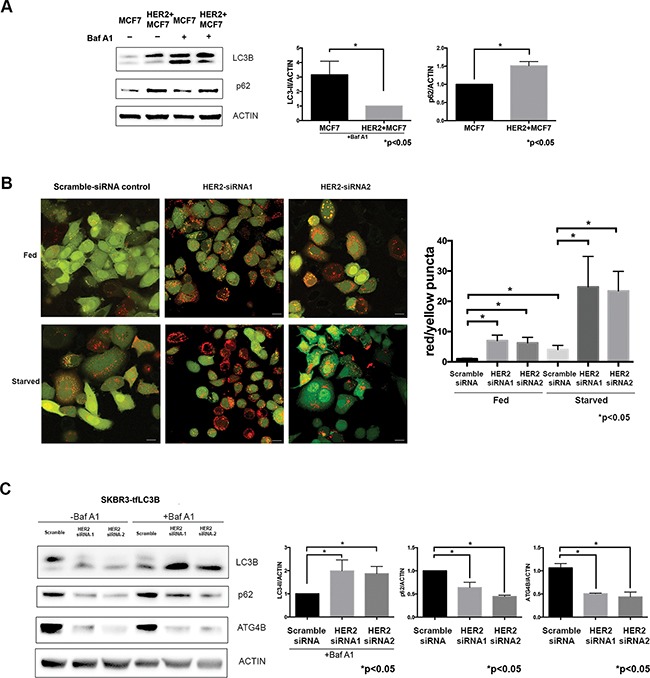
A. HER2-overexpressing cells have decreased basal autophagy levels. Western blot flux assay using saturating (60nM) concentrations of Bafilomycin A1 (Baf A1) shows LC3B-II and p62 levels in parental MCF7 cells as compared to HER2-overexpressing MCF7 cells. Bar graphs on right show LC3B-II (in the presence of Baf A1) and p62 expression, normalized to actin loading control (fold change); mean±SEM; n=3; P values are based on Student's t-test. B. HER2 knockdown increases autophagic flux. SKBR3 cells stably expressing mRFP-EGFP-LC3B protein were treated with either HER2 or scramble siRNA under fed and starved conditions. Increase in red puncta (autolysosomes) relative to yellow puncta (autophagosomes) indicates increased autophagic flux in response to HER2 knockdown. Bar graphs show average (mean±SEM) ratio of red to yellow puncta per cell. Data was collected from 3 independent experiments, and P values are based on the one-way ANOVA with Dunnett post-test. Scale bar, 50 μm. C. HER2 knockdown increases autophagic flux. Western blot flux assay using saturating (60nM) concentrations of Bafilomycin A1 (Baf A1) shows LC3B-II, p62, and ATG4B levels in cells treated with HER2 siRNAs as compared to scramble siRNA control. Bar graphs on right show LC3B-II (in the presence of Baf A1), p62, and ATG4B expression, normalized to actin loading control (fold change); mean±SEM; n=3; P values are based on Student's t-test.