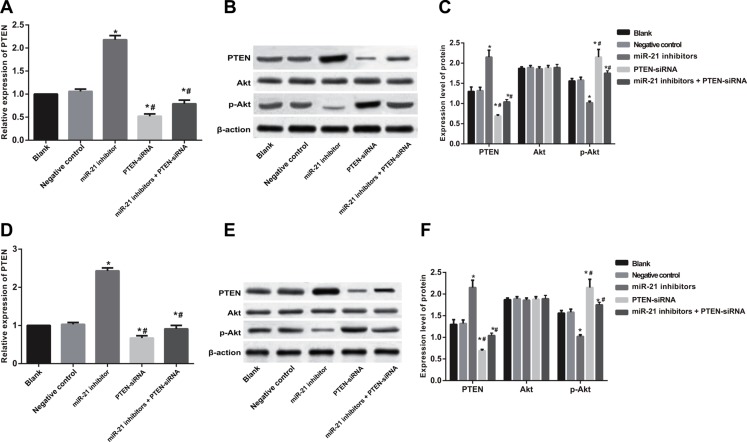
Figure 10. The gene and protein expressions of PTEN, Akt and p-Akt in SGC-7901 and KATO-III cells after cell transfection and TGF-β1 treatment for 48 h.
(A–C) PTEN, Akt and p-Akt expressions in SGC-7901 cells; (D–F) PTEN, Akt and p-Akt expressions in KATO-III cells). Note: *comparison with the blank group and NC group, P < 0.05; #comparison with the IN group, P < 0.05.

